干旱区研究 ›› 2021, Vol. 38 ›› Issue (3): 855-866.doi: 10.13866/j.azr.2021.03.27 cstr: 32277.14.AZR.20210327
王晓峰1,2( ),延雨3,李月皓3,张兴3,符鑫鑫3
收稿日期:2020-10-10
修回日期:2020-12-15
出版日期:2021-05-15
发布日期:2021-06-17
作者简介:王晓峰(1977-),男,博士,教授,主要从事生态遥感方面的教学与科研. E-mail: 基金资助:
WANG Xiaofeng1,2(),YAN Yu3,LI Yuehao3,ZHANG Xing3,FU Xinxin3
Received:2020-10-10
Revised:2020-12-15
Published:2021-05-15
Online:2021-06-17
摘要:
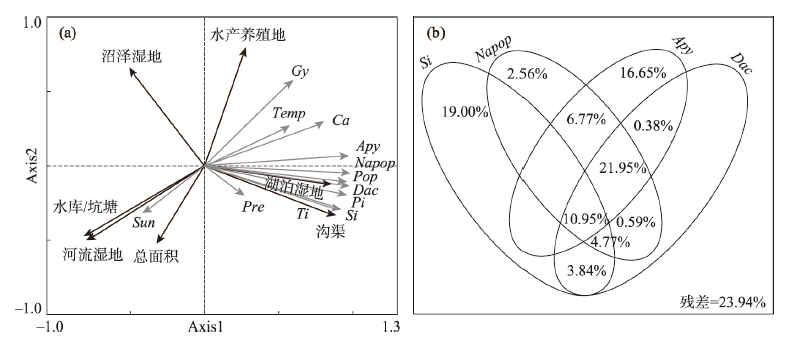
基于1990—2019年Landsat TM/OLI遥感影像,采用面向对象分类方法提取银川市湿地景观信息,通过景观指数、冗余分析方法定量分析研究区湿地景观演变特征及其驱动因素。结果表明:(1) 银川市湿地面积由1990年的264.86 km2减少到2019年的241.32 km2,减少了23.54 km2。与1990年相比,2019年的自然湿地面积减少了33.57 km2,人工湿地面积增加了10.03 km2。(2) 1990—2019年间,银川市湿地景观的破碎化程度下降、聚集程度降低、形状逐渐不规则化、多样性与异质性增加。(3) 选取12个驱动因素指标进行冗余分析,社会经济因素是湿地景观演变的主导因素,非农业人口数、水产品产量、第二产业产值与建成区面积对湿地景观变化的影响最为显著,降水量、气温等自然因素作用相对较弱。研究结果可为银川市的湿地资源的合理利用与保护提供重要参考。
王晓峰,延雨,李月皓,张兴,符鑫鑫. 银川市湿地景观演变及其驱动因素[J]. 干旱区研究, 2021, 38(3): 855-866.
WANG Xiaofeng,YAN Yu,LI Yuehao,ZHANG Xing,FU Xinxin. Wetland landscape evolution and its driving factors in Yinchuan[J]. Arid Zone Research, 2021, 38(3): 855-866.
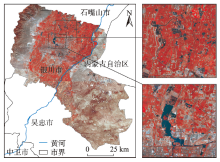
图1
研究区示意图"

表1
湿地景观分类系统"
| 一级分类 | 二级分类 | 说明 |
|---|---|---|
| 自然湿地 | 河流湿地 | 包括永久性河流、季节性或间歇性河流、洪泛平原湿地 |
| 湖泊湿地 | 包括永久性淡水湖、季节性淡水湖和季节性咸水湖 | |
| 沼泽湿地 | 主要以草本植物为主的沼泽湿地 | |
| 人工湿地 | 水库/坑塘 | 以蓄水、农业灌溉、城市景观等为主要目的的人工湿地 |
| 水产养殖地 | 以鱼、虾等水产品养殖为目的的人工湿地 | |
| 沟渠 | 以输水、灌溉为目的的沟、渠 |

图2
湿地分类规则集 注:MNDWI表示归一化差异水体指数;NDVI表示归一化植被指数;NDBI表示归一化建筑指数;Area表示影像对象面积;Dissimilatity表示相异性纹理滤波;Ellipitic Fit表示影像对象椭圆拟合度;Density表示影像对象密度;Length/width表示影像对象长宽比。"
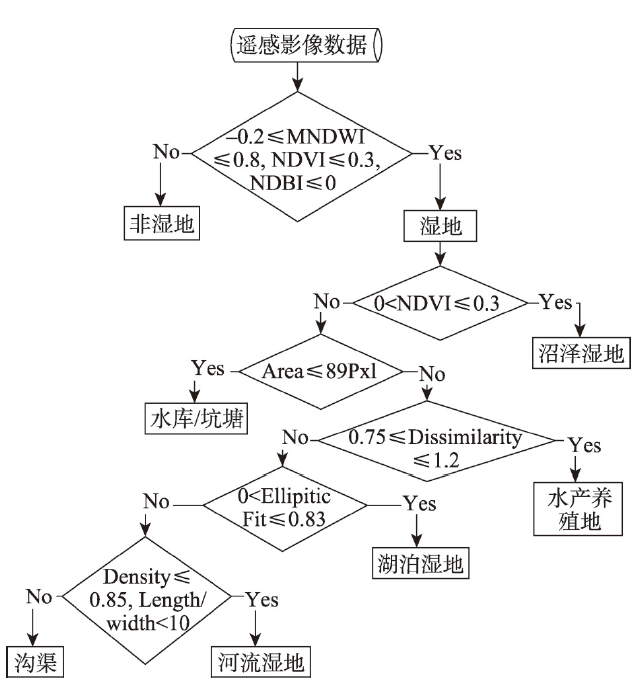
表2
面向对象分类精度评价"
| 年份 | 指标 | 河流湿地/% | 湖泊湿地/% | 沼泽湿地/% | 水库/坑塘/% | 水产养殖地/% | 沟渠/% | OA/% | Kappa |
|---|---|---|---|---|---|---|---|---|---|
| 1990 | UA | 83.33 | 80.56 | 77.78 | 88.10 | 87.90 | 85.71 | 85.65 | 0.80 |
| PA | 88.24 | 80.47 | 84.85 | 86.05 | 88.62 | 80.00 | |||
| 1995 | UA | 76.19 | 85.23 | 79.07 | 83.70 | 88.37 | 76.47 | 84.66 | 0.79 |
| PA | 80.00 | 80.65 | 77.27 | 88.28 | 86.86 | 81.25 | |||
| 2000 | UA | 76.92 | 84.48 | 84.09 | 87.94 | 85.37 | 84.62 | 85.71 | 0.81 |
| PA | 83.33 | 85.96 | 82.22 | 86.11 | 87.50 | 78.57 | |||
| 2005 | UA | 81.82 | 80.77 | 82.61 | 89.22 | 82.76 | 77.78 | 85.09 | 0.79 |
| PA | 85.71 | 81.55 | 83.82 | 88.46 | 81.36 | 82.35 | |||
| 2010 | UA | 82.61 | 83.33 | 78.43 | 88.95 | 81.03 | 86.67 | 84.91 | 0.79 |
| PA | 86.36 | 80.81 | 86.96 | 87.50 | 82.46 | 81.25 | |||
| 2015 | UA | 80.77 | 85.09 | 81.40 | 87.39 | 84.81 | 78.95 | 84.75 | 0.80 |
| PA | 80.77 | 83.62 | 81.40 | 89.66 | 82.72 | 83.33 | |||
| 2019 | UA | 85.71 | 77.11 | 84.85 | 91.96 | 80.85 | 76.92 | 87.43 | 0.78 |
| PA | 80.00 | 84.21 | 84.85 | 89.94 | 80.85 | 83.33 |
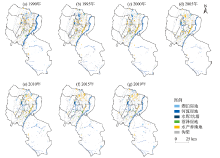
图3
银川市湿地空间分布"
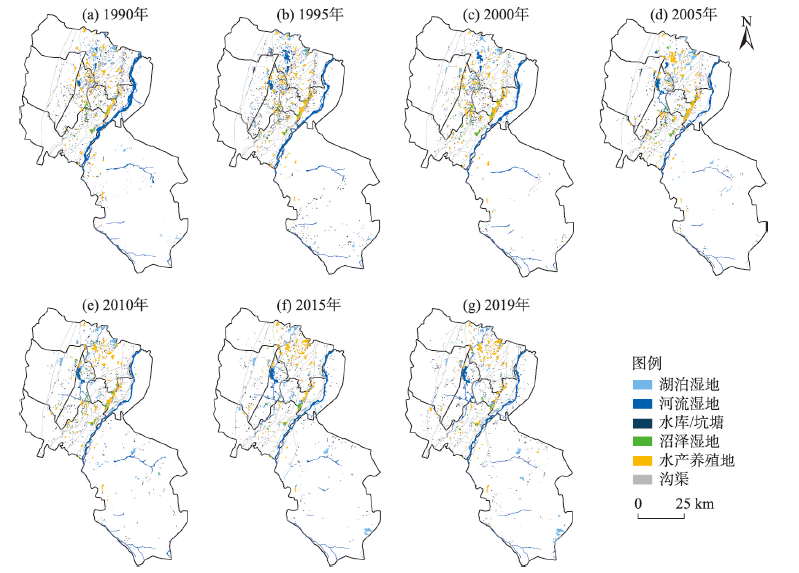
表3
银川市湿地面积变化"
| 年份 | 面积及占比 | 河流湿地 | 湖泊湿地 | 沼泽湿地 | 水库/坑塘 | 水产养殖地 | 沟渠 | 总计 |
|---|---|---|---|---|---|---|---|---|
| 1990 | 面积/km2 | 111.88 | 37.13 | 14.65 | 21.98 | 57.73 | 21.49 | 264.86 |
| 比例/% | 42.24 | 14.02 | 5.53 | 8.30 | 21.80 | 8.11 | 100 | |
| 1995 | 面积/km2 | 90.86 | 37.32 | 15.05 | 20.22 | 66.43 | 20.31 | 250.20 |
| 比例/% | 36.32 | 14.92 | 6.02 | 8.08 | 26.55 | 8.12 | 100 | |
| 2000 | 面积/km2 | 76.29 | 34.21 | 16.52 | 18.77 | 64.25 | 22.32 | 232.36 |
| 比例/% | 32.83 | 14.72 | 7.11 | 8.08 | 27.65 | 9.61 | 100 | |
| 2005 | 面积/km2 | 71.19 | 43.76 | 15.87 | 17.38 | 74.70 | 21.69 | 244.60 |
| 比例/% | 29.11 | 17.89 | 6.49 | 7.11 | 30.54 | 8.87 | 100 | |
| 2010 | 面积/km2 | 73.37 | 46.66 | 14.99 | 17.62 | 68.55 | 31.33 | 252.52 |
| 比例/% | 29.06 | 18.48 | 5.93 | 6.98 | 27.15 | 12.41 | 100 | |
| 2015 | 面积/km2 | 70.10 | 52.07 | 11.43 | 16.41 | 61.13 | 30.07 | 241.19 |
| 比例/% | 29.06 | 21.59 | 4.74 | 6.80 | 25.34 | 12.47 | 100 | |
| 2019 | 面积/km2 | 72.23 | 46.99 | 10.87 | 18.76 | 59.93 | 32.54 | 241.32 |
| 比例/% | 29.93 | 19.47 | 4.50 | 7.77 | 24.83 | 13.49 | 100 |

图4
1990—2019年银川市湿地类型变化空间分布"


图5
类型水平上的景观指数变化"
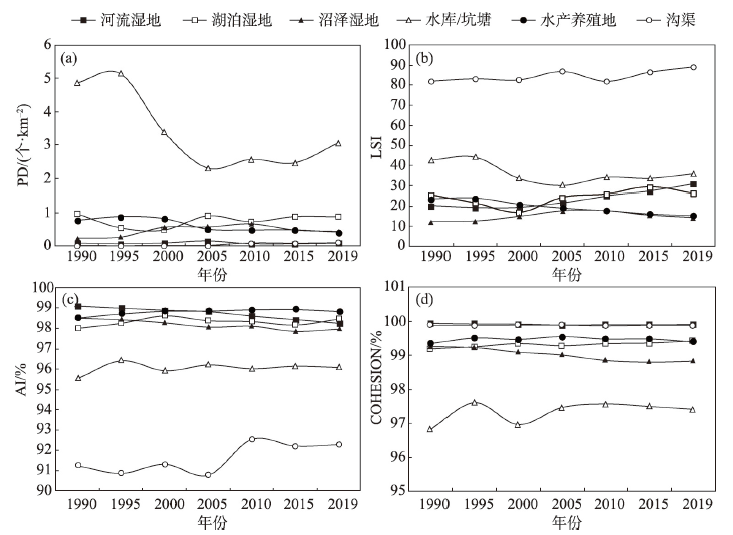
表4
景观水平上的景观指数变化"
| 年份 | PD/(个·km-2) | LSI | AI/% | SHDI |
|---|---|---|---|---|
| 1990 | 6.99 | 70.98 | 97.85 | 0.74 |
| 1995 | 6.96 | 72.10 | 97.81 | 0.77 |
| 2000 | 5.42 | 65.69 | 97.87 | 0.77 |
| 2005 | 4.52 | 68.23 | 97.82 | 0.78 |
| 2010 | 4.66 | 73.27 | 97.71 | 0.79 |
| 2015 | 4.51 | 78.04 | 97.49 | 0.78 |
| 2019 | 5.01 | 81.18 | 97.40 | 0.78 |
表5
冗余分析"
| 排序轴 | 特征值 | 湿地景观-驱动 因素相关系数 | 湿地景观变化累积百分比 | 湿地景观-驱动 因素关系变化 累积百分比 | 特征值总和 | 典型特征 值总和 | 蒙特卡罗置换检验 | |
|---|---|---|---|---|---|---|---|---|
| 第一排序轴 显著性检验 | 所有排序轴 显著性检验 | |||||||
| Axis1 | 0.62 | 0.99 | 61.60 | 66.20 | 1.00 | 0.93 | F=25.66 P=0.001 | F=17.69 P=0.001 |
| Axis2 | 0.23 | 0.95 | 84.30 | 90.60 | ||||
| Axis3 | 0.04 | 0.90 | 88.70 | 95.40 | ||||
| Axis4 | 0.04 | 0.85 | 92.70 | 99.70 | ||||

图6
冗余分析二维排序图(a)与变差分解(b) 注:图6a中Pre表示降水量;Temp表示气温;Sun表示日照时数;Pop表示总人口数;Napop表示非农业人口数;Ca表示耕地面积;Apy表示水产品产量;Gy表示粮食产量;Pi表示第一产业产值;Si表示第二产业产值;Ti表示第三产业产值;Dac表示建成区面积。图6b中变差分解小于0的值未显示。"
| [1] | 雷金睿, 陈宗铸, 陈毅青, 等. 1990—2018年海南岛湿地景观格局演变及其驱动力分析[J]. 生态环境学报, 2020,29(1):59-70. |
| [ Lei Jinrui, Chen Zongzhu, Chen Yiqing, et al. Landscape pattern changes and driving factors analysis of wetland in Hainan Island during 1990-2018[J]. Ecology and Environmental Sciences, 2020,29(1):59-70. ] | |
| [2] |
Guo M, Li J, Sheng C, et al. A review of wetland remote sensing[J]. Sensors, 2017,17(4):777.
doi: 10.3390/s17040777 |
| [3] |
Li Z, Jiang W, Wang W, et al. Ecological risk assessment of the wetlands in Beijing-Tianjin-Hebei urban agglomeration[J]. Ecological Indicators, 2020,117:106677.
doi: 10.1016/j.ecolind.2020.106677 |
| [4] |
Mao D, Wang Z, Wu J, et al. China’s wetlands loss to urban expansion[J]. Land Degradation & Development, 2018,29(8):2644-2657.
doi: 10.1002/ldr.v29.8 |
| [5] | 宫宁, 牛振国, 齐伟, 等. 中国湿地变化的驱动力分析[J]. 遥感学报, 2016,20(2):172-183. |
| [ Gong Ning, Niu Zhenguo, Qi Wei, et al. Driving forces of wetland change in China[J]. Journal of Remote Sensing, 2016,20(2):172-183. ] | |
| [6] |
Asselen S V, Verburg P H, Vermaat J E, et al. Drivers of wetland conversion: A global meta-analysis[J]. PLoS One, 2018,8(11):e81292.
doi: 10.1371/journal.pone.0081292 |
| [7] | 傅伯杰. 黄土区农业景观空间格局分析[J]. 生态学报, 1995,15(2):113-120. |
| [ Fu Bojie. The spatial pattern analysis of agricultural landscape in the loess area[J]. Acta Ecologica Sinica, 1995,15(2):113-120. ] | |
| [8] | 张敏, 宫兆宁, 赵文吉, 等. 近30年来白洋淀湿地景观格局变化及其驱动机制[J]. 生态学报, 2016,36(15):4780-4791. |
| [ Zhang Min, Gong Zhaoning, Zhao Wenji, et al. Landscape pattern change and the driving forces in Baiyangdian wetland from 1984 to 2014[J]. Acta Ecologica Sinica, 2016,36(15):4780-4791. ] | |
| [9] | 洪佳, 卢晓宁, 王玲玲. 1973—2013年黄河三角洲湿地景观演变驱动力[J]. 生态学报, 2016,36(4):924-935. |
| [ Hong Jia, Lu Xiaoning, Wang Lingling. Quantitative analysis of the factors driving evolution in the Yellow River Delta wetland in the past 40 years[J]. Acta Ecologica Sinica, 2016,36(4):924-935. ] | |
| [10] | 徐晓龙, 王新军, 朱新萍, 等. 1996—2015年巴音布鲁克天鹅湖高寒湿地景观格局演变分析[J]. 自然资源学报, 2018,33(11):1897-1911. |
| [ Xu Xiaolong, Wang Xinjun, Zhu Xinping, et al. Landscape pattern changes in alpine wetland of Bayanbulak Swan Lake during 1996-2015[J]. Journal of Natural Resources, 2018,33(11):1897-1911. ] | |
| [11] |
Wu H, Hu X, Sun S, et al. Effect of increasing of water level during the middle of dry season on landscape pattern of the two largest freshwater lakes of China[J]. Ecological Indicators, 2020,113:106283.
doi: 10.1016/j.ecolind.2020.106283 |
| [12] | Rundquist D C, Narumalani S, Narayanan R M. A review of wetlands remote sensing and defining new considerations[J]. Remote Sensing, 2001,20(3):207-226. |
| [13] |
Gallant A. The challenges of remote monitoring of wetlands[J]. Remote Sensing, 2015,7(8):10938-10950.
doi: 10.3390/rs70810938 |
| [14] | 刘吉平, 高佳, 董春月. 1954—2015年三江平原沼泽湿地变化的区域分异及影响因素[J]. 生态学报, 2019,39(13):4821-4831. |
| [ Liu Jiping, Gao Jia, Dong Chunyue. Regional differentiation and factors influencing changes in swamps in the Sanjiang Plain from 1954 to 2015[J]. Acta Ecologica Sinica, 2019,39(13):4821-4831. ] | |
| [15] | 彭凯锋, 蒋卫国, 邓越. 武汉城市圈湿地受损程度识别及驱动因素分析[J]. 自然资源学报, 2019,34(8):1694-1707. |
| [ Peng Kaifeng, Jiang Weiguo, Deng Yue. Identification of wetland damage degree and analysis of its driving forces in Wuhan Urban Agglomeration[J]. Journal of Natural Resources, 2019,34(8):1694-1707. ] | |
| [16] |
Jiang W, Lv J, Wang C, et al. Marsh wetland degradation risk assessment and change analysis: A case study in the Zoige Plateau, China[J]. Ecological Indicators, 2017,82:316-326.
doi: 10.1016/j.ecolind.2017.06.059 |
| [17] | 刘畅, 王继富. 5个时期黑龙江省天然湿地动态及其影响因素研究[J]. 湿地科学, 2017,15(1):80-84. |
| [ Liu Chang, Wang Jifu. Dynamic of natural wetlands in Heilongjiang Province in five periods and influence factors[J]. Wetland Science, 2017,15(1):80-84. ] | |
| [18] | 毛德华, 王宗明, 罗玲, 等. 1990—2013年中国东北地区湿地生态系统格局演变遥感监测分析[J]. 自然资源学报, 2016,31(8):1253-1263. |
| [ Mao Dehua, Wang Zongming, Luo Ling, et al. Monitoring the evolution of wetland ecosystem pattern in Northeast China from 1990 to 2013 based on remote sensing[J]. Journal of Natural Resources, 2016,31(8):1253-1263. ] | |
| [19] | 梁旻轩, 谢正磊, 毛德华, 等. 1980年以来5个时期洞庭湖区国际重要湿地景观动态研究[J]. 湿地科学, 2020,18(1):40-46. |
| [ Liang Minxuan, Xie Zhenglei, Mao Dehua, et al. Landscape dynamics of wetlands of international importance in Dongting Lake area for 5 periods since 1980[J]. Wetland Science, 2020,18(1):40-46. ] | |
| [20] | 陈昆仑, 齐漫, 王旭, 等. 1995—2015年武汉城市湖泊景观生态安全格局演化[J]. 生态学报, 2019,39(5):1725-1734. |
| [ Chen Kunlun, Qi Man, Wang Xu, et al. Study of urban lake landscape ecological security pattern evolution in Wuhan, 1995-2015[J]. Acta Ecologica Sinica, 2019,39(5):1725-1734. ] | |
| [21] | 焉恒琦, 朱卫红, 毛德华, 等. 长江三角洲国际重要湿地人为胁迫遥感解析[J]. 中国环境科学, 2020,40(8):3605-3615. |
| [ Yan Hengqi, Zhu Weihong, Mao Dehua, et al. Landsat-based observation of human pressure to wetlands in Ramsar sites over the Yangtze River Delta[J]. China Environmental Science, 2020,40(8):3605-3615. ] | |
| [22] | 张东方, 杜嘉, 陈智文, 等. 20世纪60年代以来6个时期盐城滨海湿地变化及其驱动因素研究[J]. 湿地科学, 2018,16(3):313-321. |
| [ Zhang Dongfang, Du Jia, Chen Zhiwen, et al. Changes of coastal wetlands in Yancheng for 6 periods since 1960s and their driving factors[J]. Wetland Science, 2018,16(3):313-321. ] | |
| [23] | 白军红, 欧阳华, 崔保山, 等. 近40年来若尔盖高原高寒湿地景观格局变化[J]. 生态学报, 2008,28(5):2245-2252. |
| [ Bai Junhong, Ouyang Hua, Cui Baoshan, et al. Changes in landscape pattern of alpine wetlands on the Zoige Plateau in the past four decades[J]. Acta Ecologica Sinica, 2008,28(5):2245-2252. ] | |
| [24] | 李妍妍, 王景升, 税燕萍, 等. 拉萨河源头麦地卡湿地景观格局及功能动态分析[J]. 生态学报, 2018,38(24):8700-8707. |
| [ Li Yanyan, Wang Jingshen, Shui Yanping, et al. Analysis of landscape pattern and ecological service function of the Mcdika wetland reserve[J]. Acta Ecologica Sinica, 2018,38(24):8700-8707. ] | |
| [25] | 周华荣. 干旱区湿地多功能景观研究的意义与前景分析[J]. 干旱区地理, 2005,28(1):16-20. |
| [ Zhou Huarong. Prospect on multifunctional landscapes of marshes in arid areas[J]. Arid Land Geography, 2005,28(1):16-20. ] | |
| [26] | 缑倩倩, 屈建军, 王国华, 等. 中国干旱半干旱地区湿地研究进展[J]. 干旱区研究, 2015,32(2):213-220. |
| [ Gou Qianqian, Qu Jianjun, Wang Guohua, et al. Progress of wetland researches in arid and semi-arid regions in China[J]. Arid Zone Research, 2015,32(2):213-220. ] | |
| [27] | 周亚军, 刘廷玺, 段利民, 等. 锡林河流域上游河谷湿地景观格局演变及其驱动力[J]. 干旱区研究, 2020,37(3):580-590. |
| [ Zhou Yajun, Liu Tingxi, Duan Limin, et al. Driving force analysis and landscape pattern evolution in the upstream valley of Xilin River Basin[J]. Arid Zone Research, 2020,37(3):580-590. ] | |
| [28] | 张娜, 韩小龙, 汤英, 等. 宁夏石嘴山市引黄灌区地下水时空变化特性及影响因素[J]. 干旱区研究, 2020,37(5):1124-1131. |
| [ Zhang Na, Han Xiaolong, Tang Ying, et al. Temporal and spatial characteristics of groundwater and its influencing factors in the Yellow River diversion irrigation area of Ningxia Shizuishan[J]. Arid Zone Research, 2020,37(5):1124-1131. ] | |
| [29] | 高祖桥, 白永平, 周亮, 等. 宁夏沿黄城市带湿地景观格局演变特征及驱动力[J]. 应用生态学报, 2020,31(10):3499-3508. |
| [ Gao Zuqiao, Bai Yongping, Zhou Liang, et al. Characteristics and driving forces of wetland landscape pattern evolution of the city belt along the Yellow River in Ningxia, China[J]. Arid Zone Research, 2020,31(10):3499-3508. ] | |
| [30] | Liu J, Liu M, Zhuang D, et al. Study on spatial pattern of land-use change in China during 1995-2000[J]. Science China Earth Sciences, 2003,46(4):373-384. |
| [31] | 刘纪远, 匡文慧, 张增祥, 等. 20世纪80年代末以来中国土地利用变化的基本特征与空间格局[J]. 地理学报, 2014,69(1):3-14. |
| [ Liu Jiyuan, Kuang Wenhui, Zhang Zenxiang, et al. Spatiotemporal characteristics, patterns and causes of land use changes in China since the late 1980s[J]. Acta Geographica Sinica, 2014,69(1):3-14. ] | |
| [32] | 国家林业局《湿地公约》履约办公室. 湿地公约履约指南[M]. 北京: 中国林业出版社, 2001: 1-8. |
| [ Ramsar Convention Compliance Office, State Forestry Administration. Wetland Convention Guideline[M]. Beijing: China Forestry Publishing House, 2001: 1-8. ] | |
| [33] | 国家林业局湿地保护管理中心. 全国湿地资源调查与检测技术规程(试行)[M]. 北京: 中国林业出版社, 2008: 4-20. |
| [ Wetland Conservation and Management Center, State Forestry Administration. Technical Rules for National Wetland Resources Survey and Monitor (Trial Implementation) [M]. Beijing: China Forestry Publishing House, 2008: 4-20. ] | |
| [34] |
Benz U C, Hofmann P, Willhauck G, et al. Multi-resolution, object-oriented fuzzy analysis of remote sensing data for GIS-ready information[J]. ISPRS Journal of Photogrammetry and Remote Sensing, 2004,58(3):239-258.
doi: 10.1016/j.isprsjprs.2003.10.002 |
| [35] | 陈建龙, 王语檬, 侯淑涛, 等. 面向对象和DEM的ZY-102C影像湿地提取研究[J]. 地球信息科学学报, 2015,17(9):1103-1109. |
| [ Chen Jianlong, Wang Yumeng, Hou Shutao, et al. Wetland information extraction of ZY-102C image based on the Object and DEM[J]. Journal of Geo-information Science, 2015,17(9):1103-1109. ] | |
| [36] | 傅伯杰, 徐延达, 吕一河. 景观格局与水土流失的尺度特征与耦合方法[J]. 地球科学进展, 2010,25(7):673-681. |
| [ Fu Bojie, Xu Yanda, Lyu Yihe. Scale characteristics and coupled research of landscape pattern and soil and water loss[J]. Advances in Earth Science, 2010,25(7):673-681. ] | |
| [37] | 邬建国. 景观生态学: 格局、过程、尺度与等级[M]. 北京: 高等教育出版社, 2007: 106-120. |
| [ Wu Jianguo. Landscape Ecology: Pattern, Process, Scale and Hierarchy[M]. Beijing: Higher Education Press, 2007: 106-120. ] | |
| [38] |
Wang X, Li Y, Chu B, et al. Spatiotemporal dynamics and driving forces of ecosystem changes: A case study of the National Barrier Zone, China[J]. Sustainability, 2020,12(16):6680.
doi: 10.3390/su12166680 |
| [39] |
Xiao F, Gao G, Shen Q, et al. Spatio-temporal characteristics and driving forces of landscape structure changes in the middle reach of the Heihe River Basin from 1990 to 2015[J]. Landscape Ecology, 2019,34(4):755-770.
doi: 10.1007/s10980-019-00801-2 |
| [40] | 李肇晨, 罗微, 陈永富, 等. 海南霸王岭陆均松空间分布格局及其与微生境异质性的关系[J]. 生态学报, 2015,35(8):2545-2554. |
| [ Li Zhaochen, Luo Wei, Chen Yongfu, et al. The relationships between microhabitat heterogeneity and the spatial distribution of Dacrydium pectinatum in Bawangling, Hainan Island[J]. Acta Ecologica Sinica, 2015,35(8):2545-2554. ] | |
| [41] | 牛振国, 张海英, 王显威, 等. 1978—2008年中国湿地类型变化[J]. 科学通报, 2012,57(16):1400-1411. |
| [ Niu Zhenguo, Zhang Haiying, Wang Xianwei, et al. Mapping wetland changes in China between 1978 and 2008[J]. Chinese Science Bulletin, 2012,57(16):1400-1411. ] | |
| [42] | 黄宁, 杨绵海, 林志兰, 等. 厦门市海岸带景观格局变化及其对生态安全的影响[J]. 生态学杂志, 2012,31(12):3193-3202. |
| [ Huang Ning, Yang Mianhai, Lin Zhilan, et al. Landscape pattern changes of Xiamen coastal zone and their impacts on local ecological security[J]. Chinese Journal of Ecology, 2012,31(12):3193-3202. ] | |
| [43] | 许吉仁, 董霁红. 南四湖湿地景观格局变化的生态系统服务价值响应[J]. 生态与农村环境学报, 2013,29(4):471-477. |
| [ Xu Jiren, Dong Jihong. Response of ecosystem in service value to changes in landscape pattern of the Nansi Lake wetland[J]. Journal of Ecology and Rural Environment, 2013,29(4):471-477. ] | |
| [44] | 张双双, 董斌, 杨斐, 等. 升金湖湿地景观格局变化对越冬鹤类地理分布的影响[J]. 长江流域资源与环境, 2019,28(10):2461-2470. |
| [ Zhang Shuangshuang, Dong Bin, Yang Fei, et al. Influence of landscape pattern change of Shengjin Lake wetland on the geographical distribution of overwintering cranes[J]. Resources and Environment in the Yangtze Basin, 2019,28(10):2461-2470. ] | |
| [45] | 王朔, 张荣群, 乔月霞. 银川平原湿地时空变化信息的可视化分析[J]. 测绘科学, 2017,42(11):56-61, 73. |
| [ Wang Shuo, Zhang Rongqun, Qiao Yuexia. Visual analysis of wetland spatio-temporal variation in Yinchuan Plain[J]. Science of Surveying and Mapping, 2017,42(11):56-61, 73. ] | |
| [46] |
张美美, 张荣群, 郝晋珉, 等. 基于ANN-CA的银川平原湿地景观演化驱动力情景模拟分析[J]. 地球信息科学学报, 2014,16(3):418-425.
doi: 10.3724/SP.J.1047.2014.00418 |
|
[ Zhang Meimei, Zhang Rongqun, Hao Jinmin, et al. The scenario simulation analysis of driving forces of wetland landscape evolution using ANN-CA in Yinchuan Plain[J]. Journal of Geo-information Science[J]. Journal of Geo-information Science 2014,16(3):418-425. ]
doi: 10.3724/SP.J.1047.2014.00418 |
|
| [47] | 国家林业局. 中国湿地资源·宁夏卷[M]. 北京: 中国林业出版社, 2015: 61. |
| [ State Forestry Administration. China Wetlands Resources(Ningxia Volume)[M]. Beijing: China Forestry Publishing House, 2015:61. ] |
| [1] | 张文睿, 孙栋元, 王亦可, 杨俊, 兰立军, 靳虎甲, 徐裕. 河西走廊水资源-生态环境-社会经济系统耦合关系及时空分异[J]. 干旱区研究, 2024, 41(9): 1527-1537. |
| [2] | 李可璇, 张蕾, 李豪, 张恩月, 李育桢, 宋彩云, 刘庚. 基于MSPA模型和电路理论的晋西北国土空间生态修复关键区域识别[J]. 干旱区研究, 2024, 41(9): 1593-1604. |
| [3] | 吴思源, 郝利娜. 2001—2021年黄河流域植被覆盖变化及其驱动因素[J]. 干旱区研究, 2024, 41(8): 1373-1384. |
| [4] | 高鹏程, 岳艳妮, 鄢继选, 王世杰, 别强. 甘南藏族自治州土地利用与生态风险时空演变及驱动因素[J]. 干旱区研究, 2024, 41(7): 1140-1152. |
| [5] | 菅政博, 罗浩, 单娜娜. “双碳”目标下新疆“三生”空间时空演变特征及碳效应[J]. 干旱区研究, 2024, 41(7): 1238-1248. |
| [6] | 蔡玉琴, 祁栋林, 王烈福, 李海凤, 张德琴. 青海省不同等级寒冷日数时空演变特征[J]. 干旱区研究, 2024, 41(5): 742-752. |
| [7] | 高雅玉, 宋玉, 赵廷红, 高金芳, 何文博, 李泽霞. 马莲河下游产水量时空演变特征[J]. 干旱区研究, 2024, 41(5): 776-787. |
| [8] | 雷菲亚, 李小双, 陶冶, 尹本丰, 荣晓莹, 张静, 陆永兴, 郭星, 周晓兵, 张元明. 西北干旱区藓类结皮覆盖下土壤多功能性特征及影响因子[J]. 干旱区研究, 2024, 41(5): 812-820. |
| [9] | 李文秀, 燕振刚. 基于地理探测器的甘肃农牧交错带土地利用时空演化及其驱动机制[J]. 干旱区研究, 2024, 41(4): 590-602. |
| [10] | 陶际峰, 包玉龙, 郭恩亮, 金额尔德木吐, 呼斯乐, 包玉海. 近40 a内蒙古冬旱时空演变特征[J]. 干旱区研究, 2024, 41(3): 387-398. |
| [11] | 朵海瑞, 傲云巴特尔, 吾健, 罗洪巍, 同德兴, 孔繁燕, 杨芳, 魏婷婷. 柴达木盆地可鲁克湖-托素湖自然保护区鸟类多样性[J]. 干旱区研究, 2024, 41(3): 521-526. |
| [12] | 孙玮婕, 乔斌, 于红妍, 赵彤, 陈奇. 基于活力-组织力-恢复力的黑河源区高寒湿地景观生态健康评估[J]. 干旱区研究, 2024, 41(2): 301-313. |
| [13] | 王思楠, 吴英杰, 王宏宙, 黎明扬, 王飞, 张雯颖, 马小茗, 于向前. 基于地理探测器的鄂尔多斯干旱时空变化驱动因素分析[J]. 干旱区研究, 2024, 41(12): 1981-1991. |
| [14] | 史继清, 罗骕翾, 张伟华, 周刊社, 胡洁, 张东东, 甘臣龙. 西藏气候季节早晚和长短等级划分指标[J]. 干旱区研究, 2024, 41(11): 1797-1807. |
| [15] | 王昱, 李能安, 雒天峰, 张英, 袁兴鹏, 田苗, 信雅玲, 胡飞燕. 梨园河流域景观格局对地表水质的影响[J]. 干旱区研究, 2024, 41(11): 1831-1841. |
|
||