干旱区研究 ›› 2024, Vol. 41 ›› Issue (2): 191-199.doi: 10.13866/j.azr.2024.02.02
周义( ), 索文姣()
收稿日期:2023-04-07
修回日期:2023-10-25
出版日期:2024-02-15
发布日期:2024-03-11
通讯作者:
索文姣. E-mail: 作者简介:周义(1985-),男,博士,讲师,研究方向为资源环境遥感. E-mail: aboatnju@163.com
基金资助:
ZHOU Yi(), SUO Wenjiao()
Received:2023-04-07
Revised:2023-10-25
Online:2024-02-15
Published:2024-03-11
摘要:
基于MOD16数据,计算作物缺水指数(Crop Water Stress Index, CWSI),结合汾河流域气象站点数据、植被指数数据和土地利用数据,采用差值法、线性趋势法和相关分析法,分析汾河流域2000—2021年干旱时空变化特征。结果表明:(1)CWSI能有效监测汾河流域旱情,其与10 cm土壤相对湿度呈显著负相关。(2)汾河流域CWSI空间分布差异明显,呈现出南湿北旱的特点。(3)汾河流域CWSI年际变化较为平稳,而月变化波动较大,5月CWSI达到年内峰值。(4)汾河流域不同生长期内干旱情况差异显著,生长季前期(4—5月)特旱区占汾河流域总面积的48.55%;生长季中期(6—8月)基本全域无旱;生长季后期(9—10月),仅11.17%的地区发生干旱。(5)不同土地利用类型干旱程度不同,CWSI从小到大依次为:林地(0.686)<草地(0.749)<耕地(0.751)<未利用地(0.758)<城镇(0.765)。本研究结果可为汾河流域旱情监测和抗旱决策的制定提供科学数据支撑。
周义, 索文姣. 基于CWSI的汾河流域干旱时空变化特征[J]. 干旱区研究, 2024, 41(2): 191-199.
ZHOU Yi, SUO Wenjiao. Spatialtemporal variation characteristics of drought in the Fenhe River Basin based on CWSI[J]. Arid Zone Research, 2024, 41(2): 191-199.
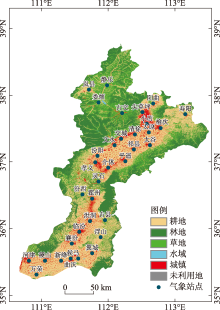
图1
汾河流域土地利用类型和气象站点分布"

表1
数据名称及来源"
| 数据 | 时间 | 数据来源 |
|---|---|---|
| MOD16A3 | 2000—2021年 | NTSG( |
| MOD16A2 | ||
| 土壤相对湿度 | 2012年4—10月 | 国家气象信息中心( |
| 降水 | 2001—2020年 | 国家青藏高原科学数据中心 |
| 温度 | 2001—2020年 | ( |
| 植被指数 | 2001—2020年 | 中国科学院资源环境科学数据中心( |
| 30 m土地利用 | 2020年 | ( |
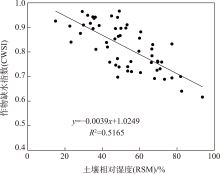
图2
作物缺水指数与10 cm土壤相对湿度散点图"
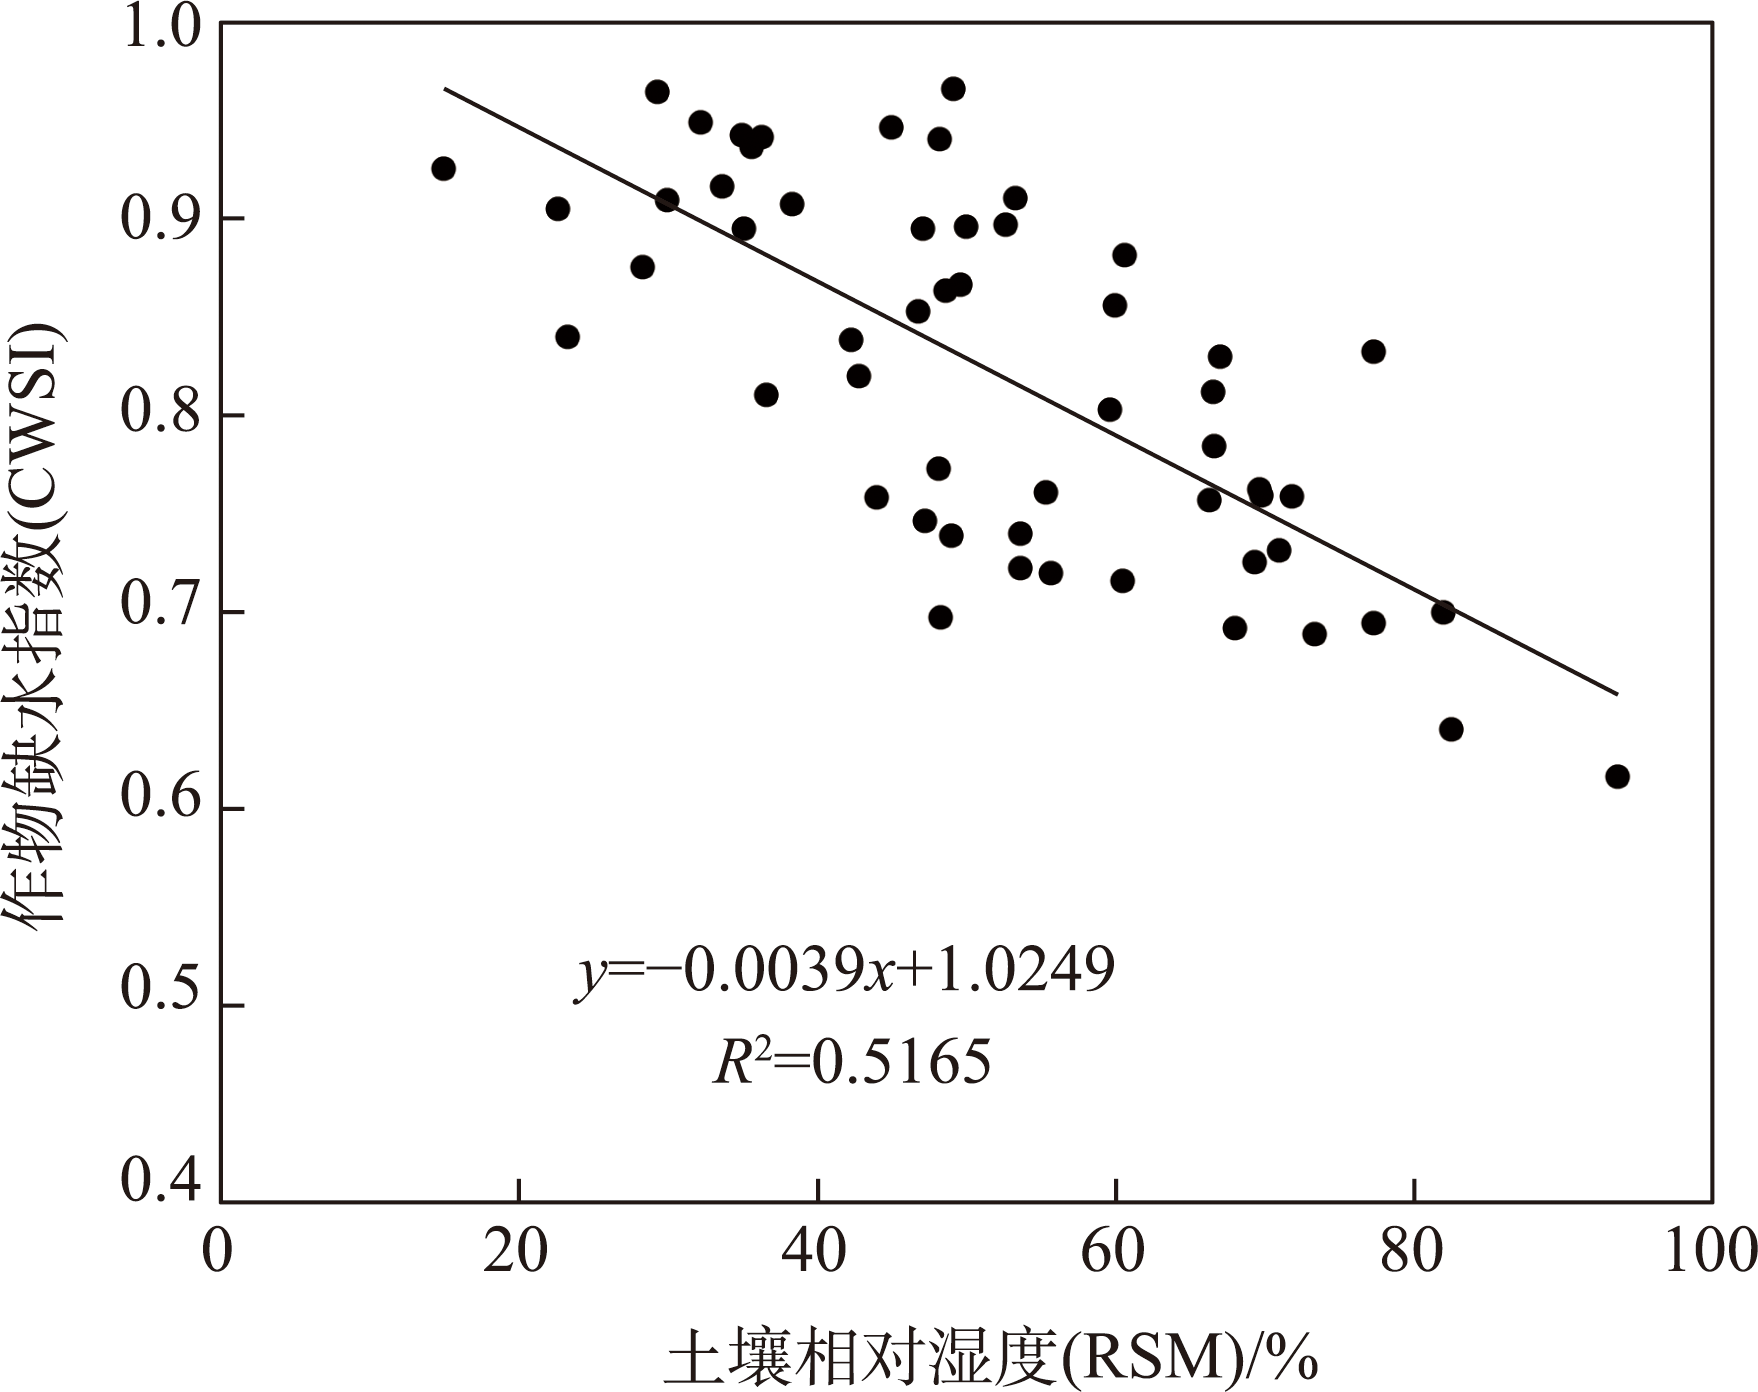
表2
干旱等级划分标准"
| 等级 | 类型 | RSM/% | CWSI |
|---|---|---|---|
| 1 | 无旱 | >60 | <0.7909 |
| 2 | 轻旱 | 50~60 | 0.7909~0.8296 |
| 3 | 中旱 | 40~50 | 0.8296~0.8689 |
| 4 | 重旱 | 30~40 | 0.8689~0.9079 |
| 5 | 特旱 | <30 | >0.9079 |

图3
汾河流域ET、PET、DET、CWSI年际变化"
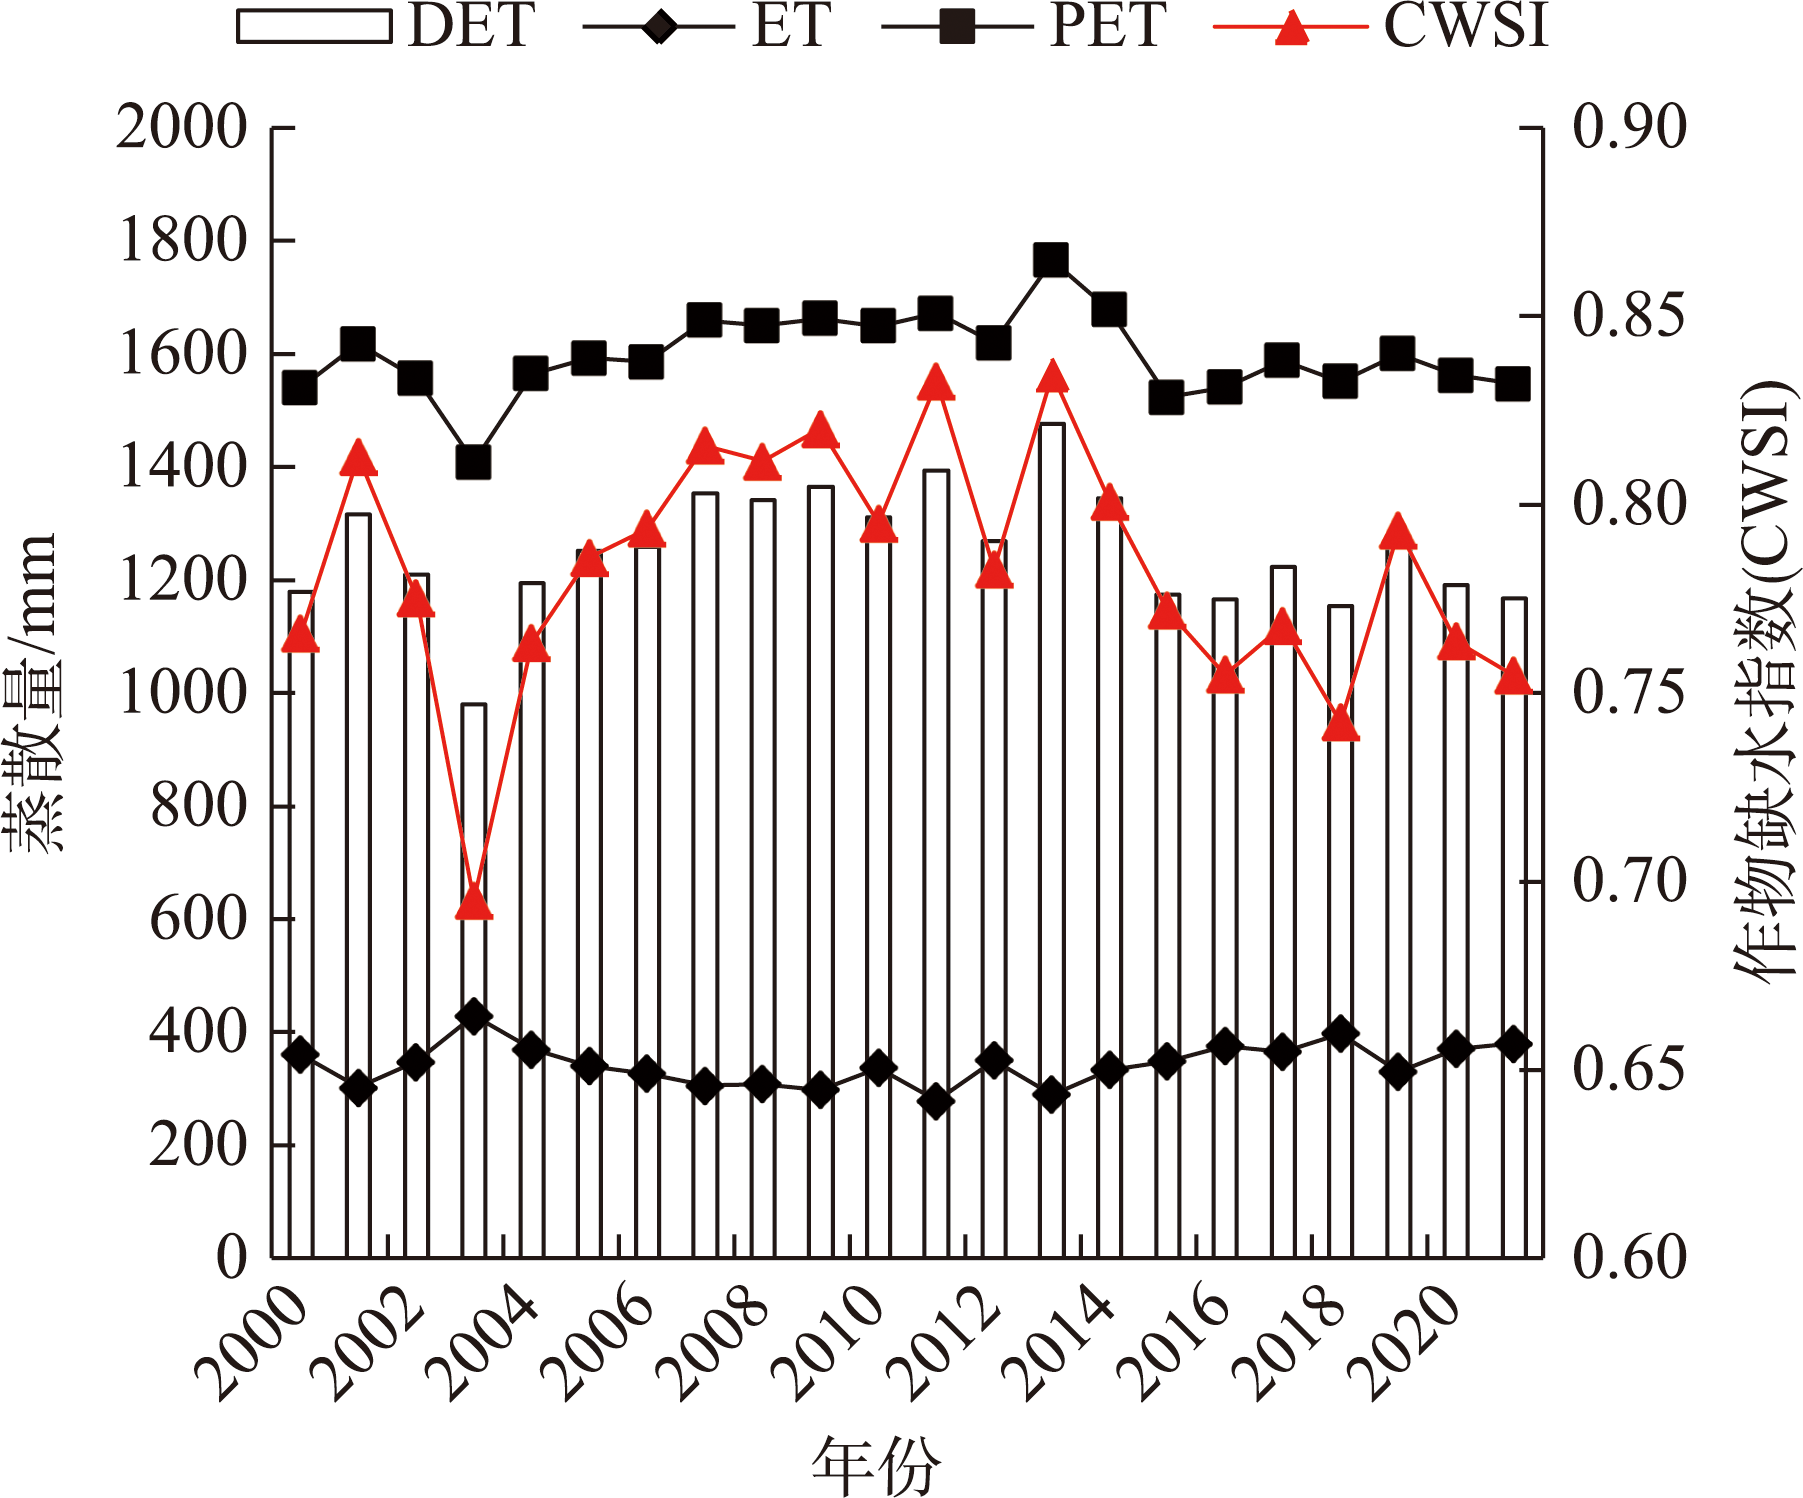

图4
汾河流域干旱类型面积占比年变化"
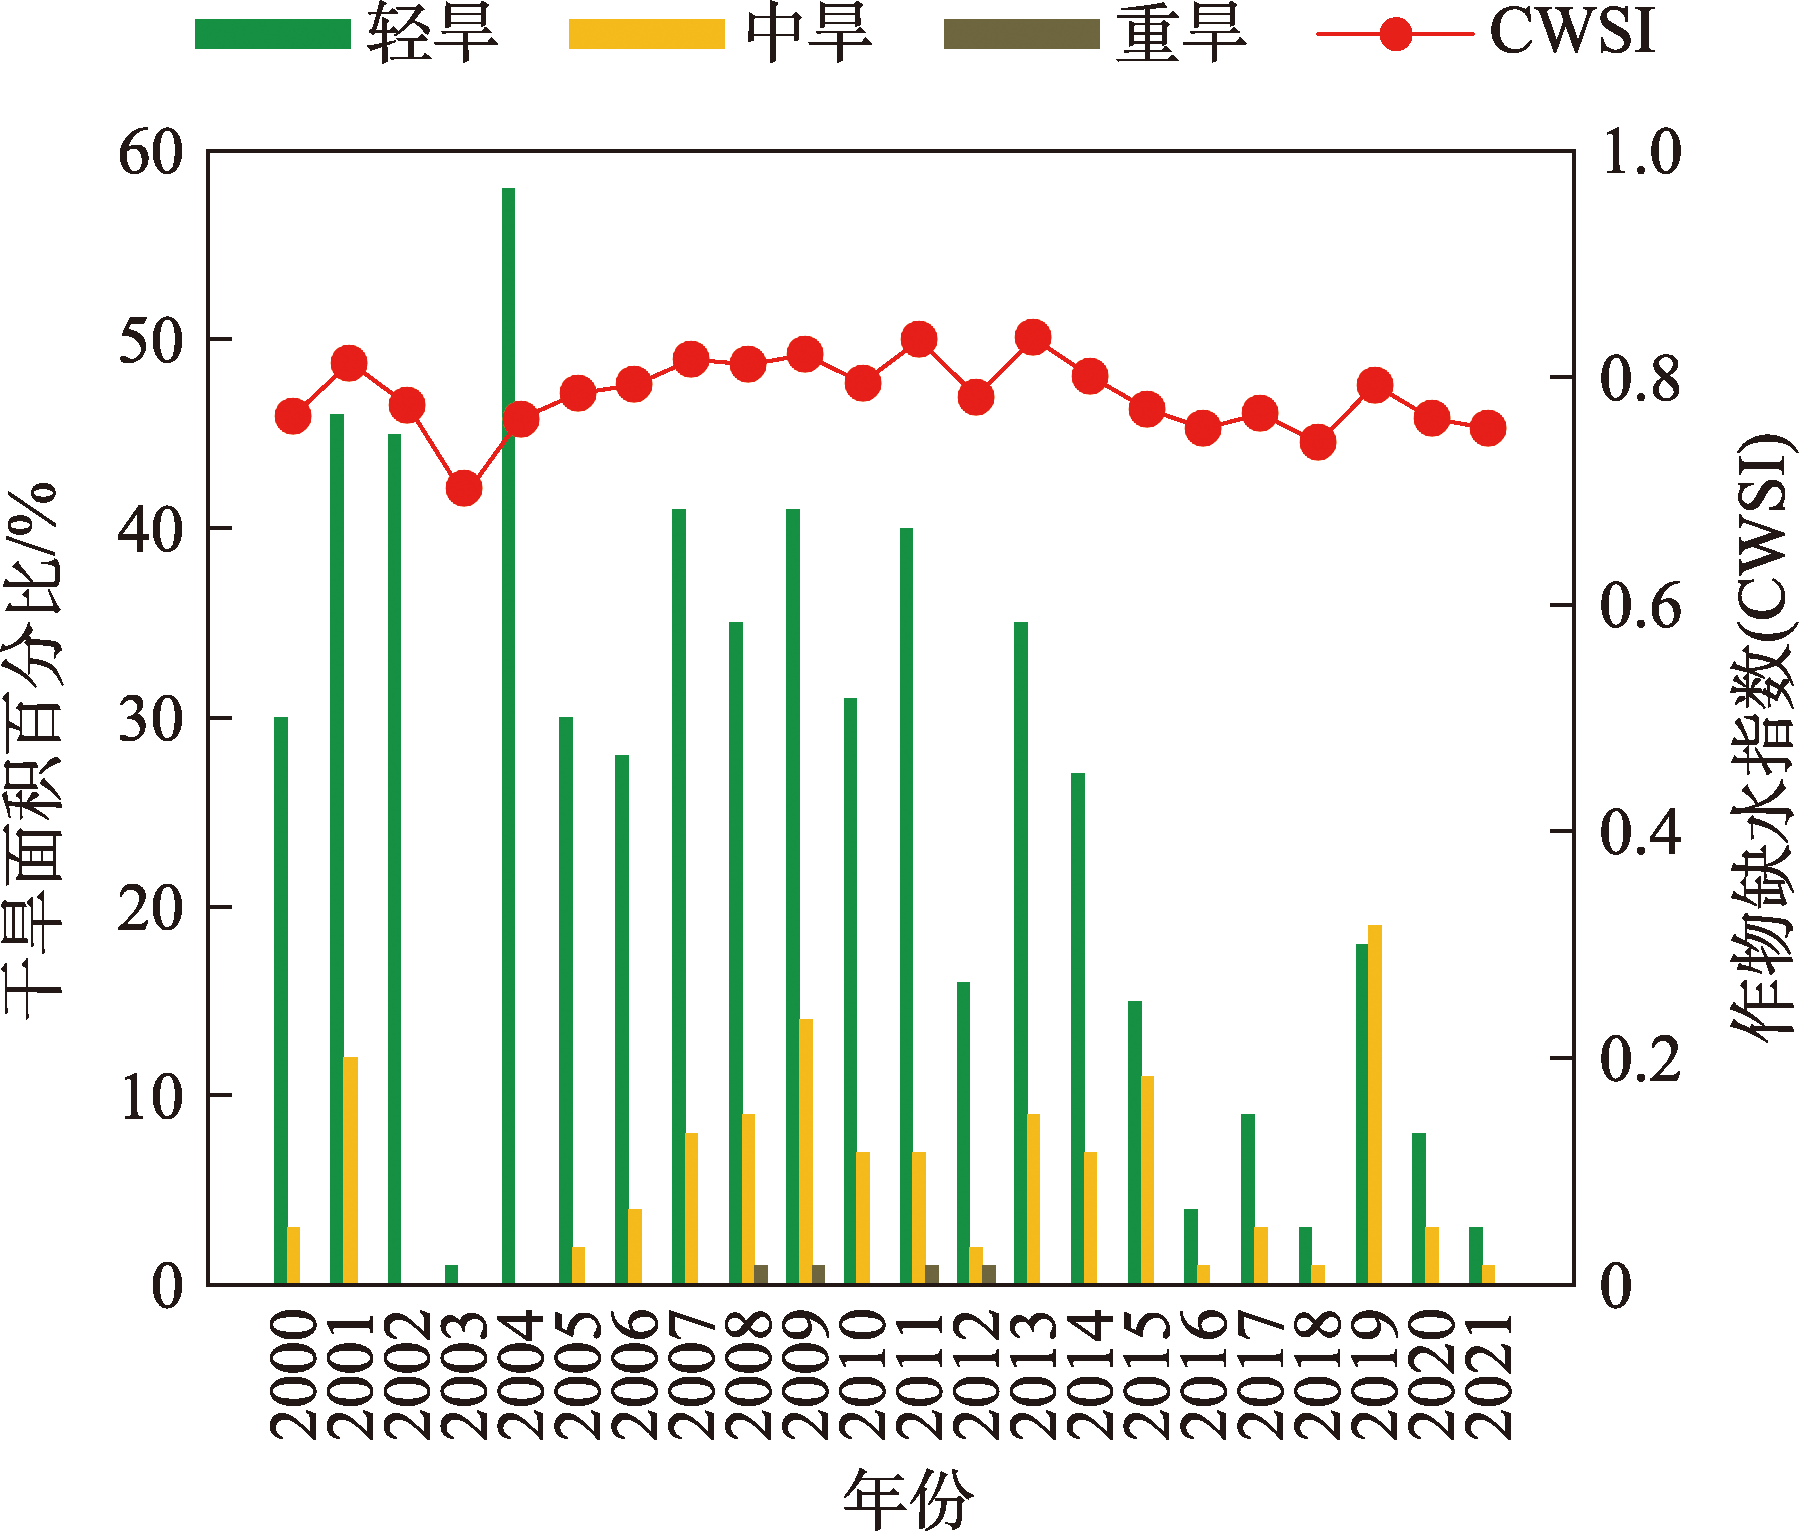
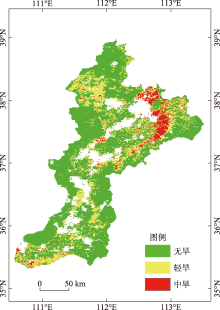
图5
汾河流域年均CWSI空间分布"

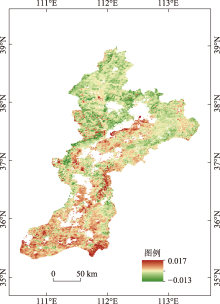
图6
汾河流域CWSI变化趋势"

表3
干旱年际变化下的相关系数"
| 降水量 | 温度 | NDVI | |
|---|---|---|---|
| CWSI | -0.308** | 0.214** | -0.422** |
| ET | 0.233** | -0.161** | 0.503** |
| PET | -0.351** | 0.27** | 0.030 |
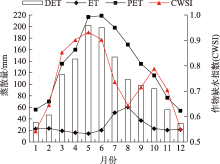
图7
汾河流域ET、PET、DET和CWSI年内变化"


图8
汾河流域干旱类型面积占比月变化"
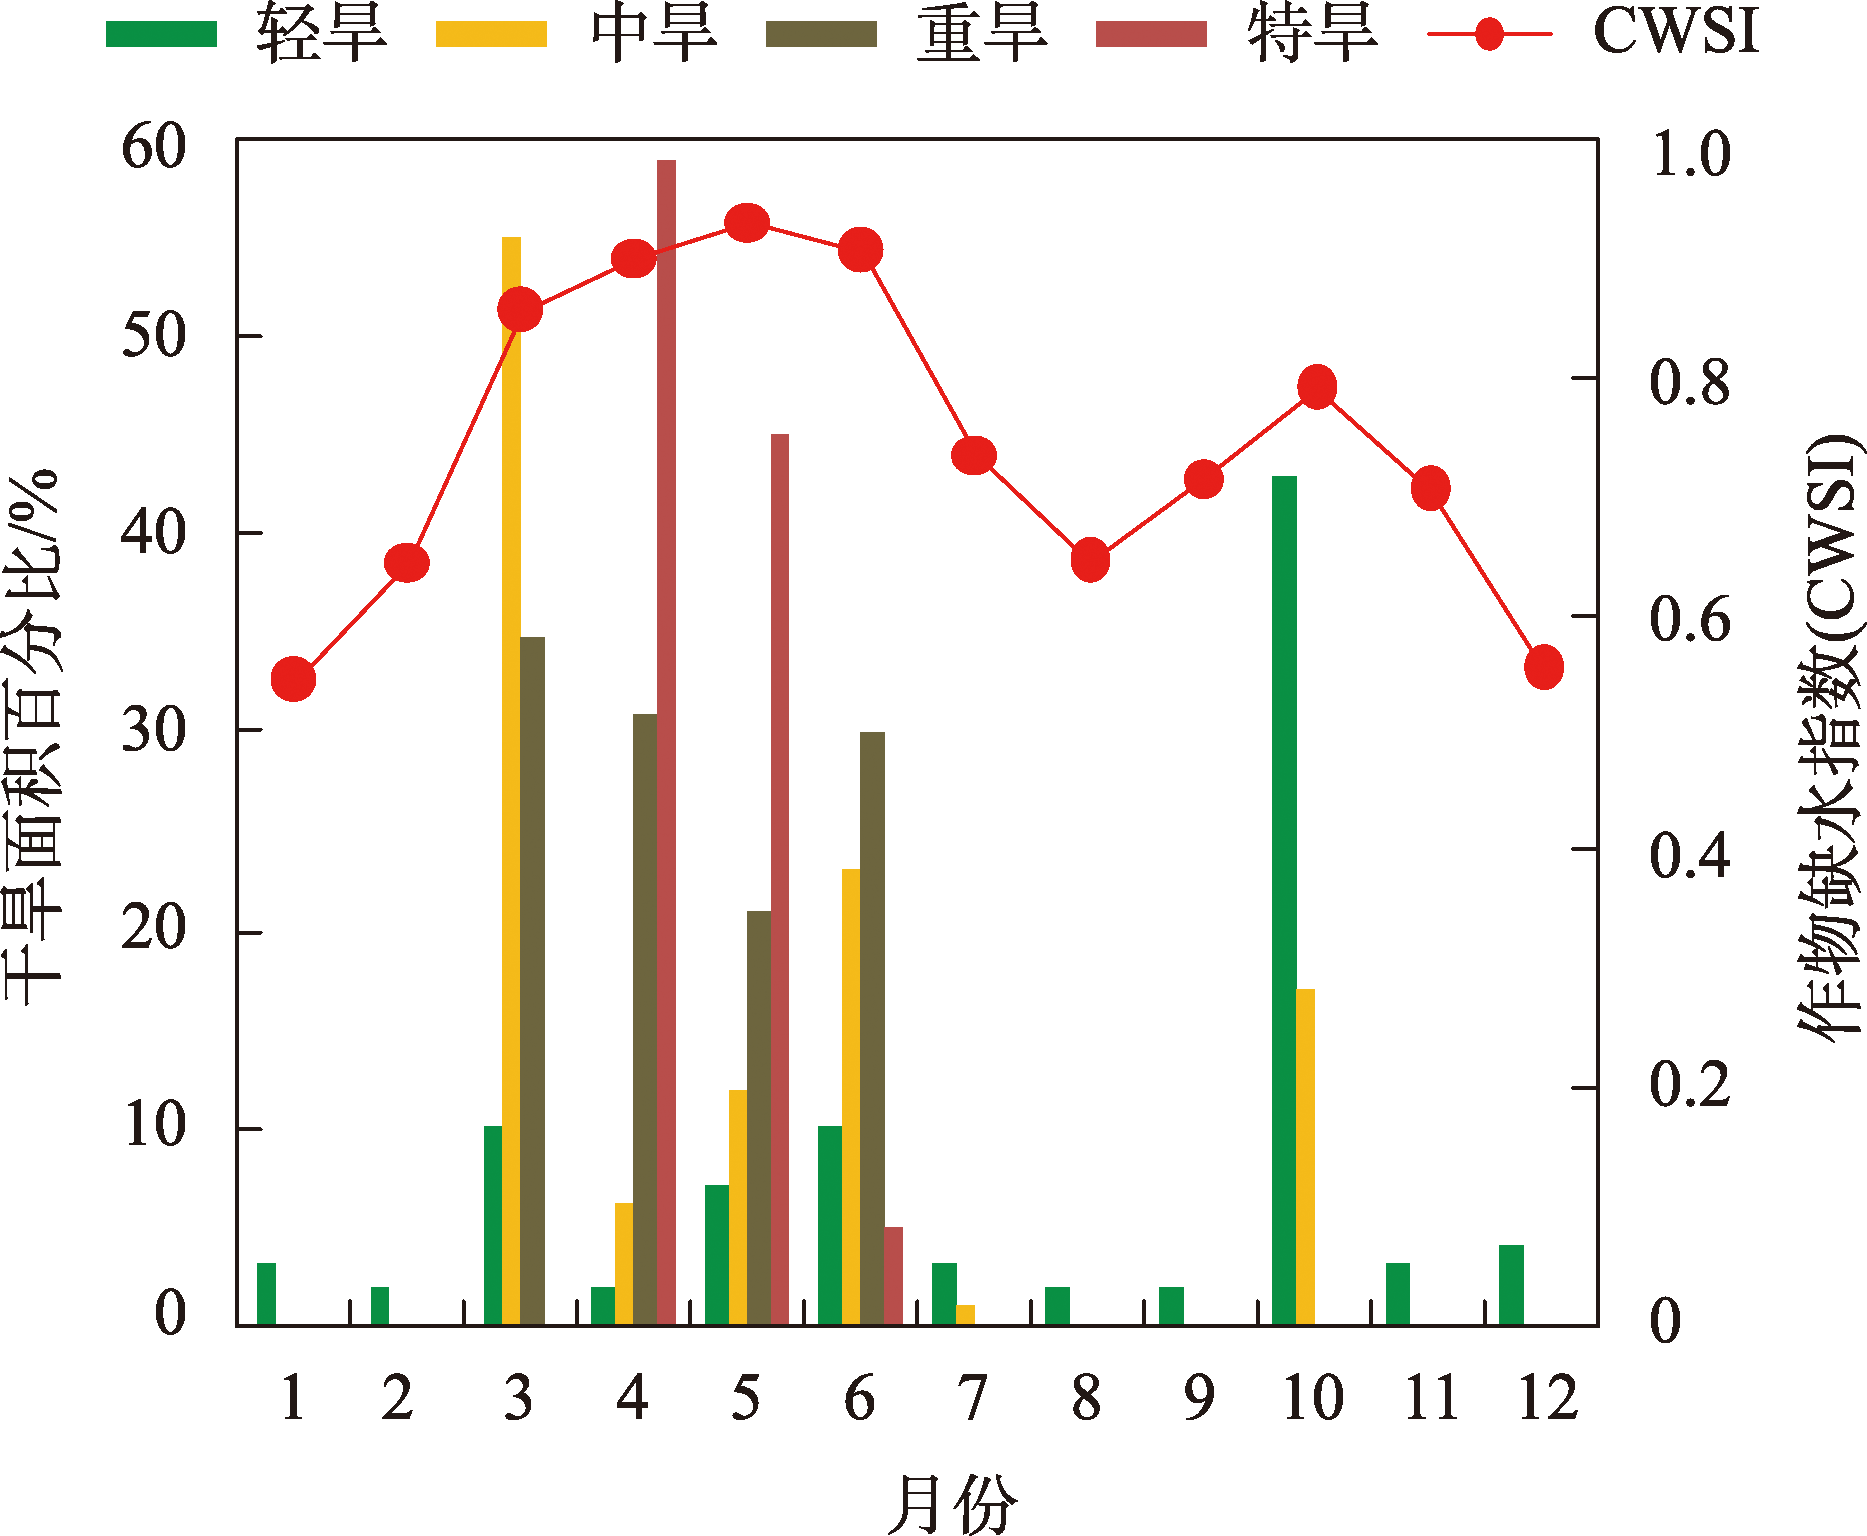
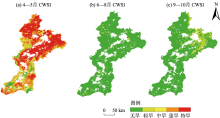
图9
汾河流域生长季CWSI空间分布"

表4
生长季不同时期干旱类型面积占比"
| 轻旱 | 中旱 | 重旱 | 特旱 | |
|---|---|---|---|---|
| 4—5月 | 6.83% | 13.29% | 25.08% | 48.55% |
| 6—8月 | 5.97% | 0.16% | 0 | 0 |
| 9—10月 | 11.03% | 0.14% | 0 | 0 |
表5
干旱月变化下的相关系数"
| 降水量 | 温度 | NDVI | |
|---|---|---|---|
| CWSI | -0.439** | 0.417** | -0.366** |
| ET | 0.736** | 0.516** | 0.718** |
| PET | 0.341** | 0.803** | 0.352** |
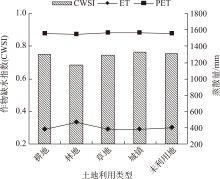
图10
不同土地利用类型下年均ET、PET、CWSI的变化"

| [1] |
张强, 韩兰英, 张立阳, 等. 论气候变暖背景下干旱和干旱灾害风险特征与管理策略[J]. 地球科学进展, 2014, 29(1): 80-91.
doi: 1001-8166(2014)01-0080-12 |
|
[Zhang Qiang, Han Lanying, Zhang Liyang, et al. Analysis on the character and management strategy of drought disaster and risk under the climatic warming[J]. Advances in Earth Science, 2014, 29(1): 80-91.]
doi: 1001-8166(2014)01-0080-12 |
|
| [2] | 吴孟泉, 崔伟宏, 李景刚. 温度植被干旱指数(TVDI)在复杂山区干旱监测的应用研究[J]. 干旱区地理, 2007, 30(1): 30-35. |
| [Wu Mengquan, Cui Weihong, Li Jinggang. Monitoring drought in mountainous area based on temperature/vegetation dryness index (TVDI)[J]. Arid Land Geography, 2007, 30(1): 30-35.] | |
| [3] |
汪左, 王芳, 张运. 基于CWSI的安徽省干旱时空特征及影响因素分析[J]. 自然资源学报, 2018, 33(5): 853-866.
doi: 10.11849/zrzyxb.20170480 |
| [Wang Zuo, Wang Fang, Zhang Yun. Spatio-temporal distribution characteristics and influencing factors of drought in Anhui Province based on CWSI[J]. Journal of Natural Resources, 2018, 33(5): 853-866.] | |
| [4] | 张强, 鞠笑生, 李淑华. 三种干旱指标的比较和新指标的确定[J]. 气象科技, 1998(2): 49-53. |
| [Zhang Qiang, Ju Xiaosheng, Li Shuhua. Comparison of three drought indicators and identification of new indicators[J]. Meteorological Science and Technology, 1998(2): 49-53.] | |
| [5] | 王劲松, 郭江勇, 倾继祖. 一种K干旱指数在西北地区春旱分析中的应用[J]. 自然资源学报, 2007, 22(5): 709-717. |
|
[Wang Jinsong, Guo Jiangyong, Qing Jizu. Application of a kind of K drought index in the spring drought analysis in Northwest China[J]. Journal of Natural Resources, 2007, 22(5): 709-717.]
doi: 10.11849/zrzyxb.2007.05.005 |
|
| [6] | 邹旭恺, 任国玉, 张强. 基于综合气象干旱指数的中国干旱变化趋势研究[J]. 气候与环境研究, 2010, 15(4): 371-378. |
| [Zou Xukai, Ren Guoyu, Zhang Qiang. Droughts variations in China based on a compound index of meteorological drought[J]. Climatic and Environmental Research, 2010, 15(4): 371-378.] | |
| [7] | 陈家宁, 孙怀卫, 王建鹏, 等. 综合气象干旱指数改进及其适用性分析[J]. 农业工程学报, 2020, 36(16): 71-77. |
| [Chen Jianing, Sun Huaiwei, Wang Jianpeng, et al. Improvement of comprehensive meteorological drought index and its applicability analysis[J]. Transactions of the Chinese Society of Agricultural Engineering, 2020, 36(16): 71-77.] | |
| [8] | 王晓燕, 李净, 邢立亭. 基于3种机器学习方法的农业干旱监测比较[J]. 干旱区研究, 2022, 39(1): 322-332. |
| [Wanng Xiaoyan, Li Jing, Xing Liting. Comparative agricultural drought monitoring based on three machine learning methods[J]. Arid Zone Research, 2022, 39(1): 322-332.] | |
| [9] | 刘安麟, 李星敏, 何延波, 等. 作物缺水指数法的简化及在干旱遥感监测中的应用[J]. 应用生态学报, 2004, 15(2): 210-214. |
|
[Liu Anlin, Li Xingmin, He Yanbo, et al. Simplification of crop shortage water index and its application in drought remote sensing monitoring[J]. Chinese Journal of Applied Ecology, 2004, 15(2): 210-214.]
pmid: 15146625 |
|
| [10] | 王玲玲, 张友静, 佘远见, 等. 遥感旱情监测方法的比较与分析[J]. 遥感信息, 2010, 25(5): 49-53. |
| [Wang Lingling, Zhang Youjing, She Yuanjian, et al. Analysis and comparison of drought monitoring methods by remote sensing[J]. Remote Sensing of Information, 2010, 25(5): 49-53.] | |
| [11] | 田国珍, 武永利, 梁亚春, 等. 基于蒸散发的干旱监测及时效性分析[J]. 干旱区地理, 2016, 39(4): 721-729. |
| [Tian Guozhen, Wu Yongli, Liang Yachun, et al. Drought monitoring and timeliness based on evapotranspiration model[J]. Arid Land Geography, 2016, 39(4): 721-729.] | |
| [12] |
Mu Q Z, Heinsch F A, Zhao M S, et al. Development of a global evapotranspiration algorithm based on MODIS and global meteorology data[J]. Remote Sensing of Environment, 2007, 111(4): 519-536.
doi: 10.1016/j.rse.2007.04.015 |
| [13] |
Mu Q Z, Zhao M S, Running S W. Improvements to a MODIS global terrestrial evapotranspiration algorithm[J]. Remote Sensing of Environment, 2011, 115(8): 1781-1800.
doi: 10.1016/j.rse.2011.02.019 |
| [14] |
张静, 任志远. 基于MOD16的汉江流域地表蒸散发时空特征[J]. 地理科学, 2017, 37(2): 274-282.
doi: 10.13249/j.cnki.sgs.2017.02.014 |
|
[Zhang Jing, Ren Zhiyuan. Spatiotemporal characteristics of evapotranspiration based on MOD16 in the Hanjiang River Basin[J]. Scientia Geographica Sinica, 2017, 37(2): 274-282.]
doi: 10.13249/j.cnki.sgs.2017.02.014 |
|
| [15] | 吴桂平, 刘元波, 赵晓松, 等. 基于MOD16产品的鄱阳湖流域地表蒸散量时空分布特征[J]. 地理研究, 2013, 32(4): 617-627. |
|
[Wu Guiping, Liu Yuanbo, Zhao Xiaosong, et al. Spatio-temporal variations of evapotranspiration in Poyang Lake Basin using MOD16 products[J]. Geographical Research, 2013, 32(4): 617-627.]
doi: 10.11821/yj2013040004 |
|
| [16] |
温媛媛, 赵军, 王炎强, 等. 基于MOD16的山西省地表蒸散发时空变化特征分析[J]. 地理科学进展, 2020, 39(2): 255-264.
doi: 10.18306/dlkxjz.2020.02.007 |
|
[Wen Yuanyuan, Zhao Jun, Wang Yanqiang, et al. Spatiotemporal variation characteristics of surface evapotranspiration in Shanxi Province based on MOD16[J]. Progress in Geography, 2020, 39(2): 255-264.]
doi: 10.18306/dlkxjz.2020.02.007 |
|
| [17] | 李晴, 杨鹏年, 彭亮, 等. 基于MOD16数据的焉耆盆地蒸散量变化研究[J]. 干旱区研究, 2021, 38(2): 351-358. |
| [Li Qing, Yang Pengnian, Peng Liang, et al. Study of the variation trend of evapotranspiration in the Yanqi Basin based on MOD16 data[J]. Arid Zone Research, 2021, 38(2): 351-358.] | |
| [18] | 康利刚, 曹生奎, 曹广超, 等. 青海湖沙柳河流域蒸散发时空变化特征[J]. 干旱区研究, 2023, 40(3): 358-372. |
| [Kang Ligang, Cao Shengkui, Cao Guangchao, et al. Temporal and spatial changes of evapotranspiration in the Shaliu River Basin of Qinghai Lake[J]. Arid Zone Research, 2023, 40(3): 358-372.] | |
| [19] | 何慧娟, 卓静, 李红梅, 等. 基于MOD16产品的陕西关中地区干旱时空分布特征[J]. 干旱地区农业研究, 2016, 34(1): 236-241. |
| [He Huijuan, Zhuo Jing, Li Hongmei, et al. Spatial-temporal distribution characteristics of drought in Guanzhong region of Shaanxi Province based on MOD16 products[J]. Agricultural Research in the Arid Areas, 2016, 34(1): 236-241.] | |
| [20] | 刘秀红, 李智才, 刘秀春, 等. 山西春季干旱的特征及成因分析[J]. 干旱区资源与环境, 2011, 25(9): 156-160. |
| [Liu Xiuhong, Li Zhicai, Liu Xiuchun, et al. Features and causes of spring drought in Shanxi[J]. Journal of Arid Land Resources and Environment, 2011, 25(9): 156-160.] | |
| [21] | 李京京, 吕哲敏, 石小平, 等. 基于地形梯度的汾河流域土地利用时空变化分析[J]. 农业工程学报, 2016, 32(7): 230-236. |
| [Li Jingjing, Lv Zhemin, Shi Xiaoping, et al. Spatiotemporal variations analysis for land use in Fen River Basin based on terrain gradient[J]. Transactions of the Chinese Society of Agricultural Engineering, 2016, 32(7): 230-236.] | |
| [22] |
张亚琳, 赵海燕, 王春玲, 等. 1979—2014年汾河流域干旱时空特征[J]. 中国农学通报, 2018, 34(3): 145-151.
doi: 10.11924/j.issn.1000-6850.casb16120143 |
|
[Zhang Yalin, Zhao Haiyan, Wang Chunling, et al. Temporal and spatial characteristics of drought from 1979 to 2014 in Fen River Basin[J]. Chinese Agricultural Science Bulletin, 2018, 34(3): 145-151.]
doi: 10.11924/j.issn.1000-6850.casb16120143 |
|
| [23] | 苏迎庆, 张恩月, 刘源, 等. 汾河流域土地利用变化及生态环境效应[J]. 干旱区研究, 2022, 39(3): 968-977. |
| [Su Yingqing, Zhang Enyue, Liu Yuan, et al. Land-use changes and ecological environment effects on Fen River Basin[J]. Arid Zone Research, 2022, 39(3): 968-977.] | |
| [24] |
史利江, 刘敏, 李艳萍, 等. 汾河流域县域经济差异的时空格局演变及驱动因素[J]. 地理研究, 2020, 39(10): 2361-2378.
doi: 10.11821/dlyj020190785 |
|
[Shi Lijiang, Liu Min, Li Yanping, et al. The spatio-temporal evolution and influencing factors of economic difference at county level in Fenhe River Basin[J]. Geographical Research, 2020, 39(10): 2361-2378.]
doi: 10.11821/dlyj020190785 |
|
| [25] | 伍博炜, 杨胜天, 邵南方, 等. 黄土高原生态脆弱区土地利用变化对生态系统服务价值的影响——以汾河流域为例[J]. 水土保持研究, 2019, 26(5): 340-345. |
| [Wu Bowei, Yang Shengtian, Shao Nanfang, et al. Effects of land use change on ecosystem service value in fragile ecological area of the Loess Plateau: A case study of Fenhe River Basin[J]. Research of Soil and Water Conservation, 2019, 26(5): 340-345.] | |
| [26] |
Jackson R D, Idso S B, Reginato R J, et al. Canopy temperature as a crop water stress indicator[J]. Water Resources Research, 1981, 17(4): 1133-1138.
doi: 10.1029/WR017i004p01133 |
| [27] |
Jackson R D, Kustas W P, Choudhury B J. A reexamination of the crop water stress index[J]. Irrigation Science, 1988, 9(4): 309-317.
doi: 10.1007/BF00296705 |
| [28] |
Tong S, Zhang J, Bao Y. Interdecadal spatiotemporal variations of aridity based on temperature and precipitation in Inner Mongolia, China[J]. Polish Journal of Environmental Studies, 2017, 26(2): 819-826.
doi: 10.15244/pjoes/65840 |
| [29] |
Pearson K. Note on regression and inheritance in the case of two parents[J]. Proceedings of the Royal Society of London, 1895, 58: 240-242.
doi: 10.1098/rspl.1895.0041 |
| [30] | 张洁, 武建军, 周磊, 等. 基于MODIS数据的农业干旱监测方法对比分析[J]. 遥感信息, 2012, 27(5): 48-54. |
| [Zhang Jie, Wu Jianjun, Zhou Lei, et al. Comparative study on remotely sensed methods of monitoring agricultural drought based on MODIS data[J]. Remote Sensing Information, 2012, 27(5): 48-54.] | |
| [31] | 张强, 邹旭凯, 肖风劲, 等. GB/T 20481-2006. 气象干旱等级[S]. 北京: 中国标准出版社, 2006. |
| [Zhang Qiang, Zou Xukai, Xiao Fengjin, et al. GB/T 20481-2006. The Grade of Meteorological Drought[S]. Beijing: China Standard Press, 2006.] | |
| [32] | 马梓策. 华北地区干旱时空变化特征及其影响因素分析[D]. 呼和浩特: 内蒙古师范大学, 2020. |
| [Ma Zice. Spatial and Temporal Characteristics of Drought and Its Influencing Factors in North China[D]. Hohhot: Inner Mongol Normal University, 2020.] |
| [1] | 袁萍, 韩欢, 赵红梅, 李从娟. 裸露与沙埋对极端干旱区凋落物分解和养分释放的影响[J]. 干旱区研究, 2024, 41(2): 293-300. |
| [2] | 刘一丹, 姚晓军, 李宗省, 胡家瑜. 气候变化和土地利用覆盖变化对河西地区植被净初级生产力的影响[J]. 干旱区研究, 2024, 41(1): 169-180. |
| [3] | 白炬, 刘晓林, 李申, 梁哲铭, 胥子航, 王永亮, 杨治平. 污泥热碱液对干旱胁迫下小青菜生长的缓解机制[J]. 干旱区研究, 2024, 41(1): 80-91. |
| [4] | 颜巧芳, 单立山, 解婷婷, 王红永, 师亚婷. 珍珠柴幼苗叶片和根系形态特征对干旱胁迫的响应[J]. 干旱区研究, 2024, 41(1): 92-103. |
| [5] | 汪翔, 吕海深, 朱永华, 郭晨煜. 两种河道洪水演进方法在新疆山区的应用比较[J]. 干旱区研究, 2023, 40(8): 1240-1247. |
| [6] | 文妙霞, 何学高, 刘欢, 张婧, 罗晨, 贾丰铭, 王义贵, 胡云云. 基于地理探测器的宁夏草地植被覆被时空分异及驱动因子[J]. 干旱区研究, 2023, 40(8): 1322-1332. |
| [7] | 李虹, 李忠勤, 陈普晨, 彭加加. 近20 a新疆阿尔泰山积雪时空变化及其影响因素[J]. 干旱区研究, 2023, 40(7): 1040-1051. |
| [8] | 王士维, 孙栋元, 周敏, 王亦可, 王祥镔, 季宗虎, 张文睿, 武兰珍. 1951—2020年疏勒河流域气温时空变化特征[J]. 干旱区研究, 2023, 40(7): 1065-1074. |
| [9] | 赵卓怡, 郝兴明. 基于Priestley-Taylor方法的中亚干旱区实际蒸散特征及归因[J]. 干旱区研究, 2023, 40(7): 1085-1093. |
| [10] | 吕潇雨, 郭浩, 孟翔晨, 包安明, 田芸菲, 朱丽. 基于三维识别的中国干旱事件演变特征分析[J]. 干旱区研究, 2023, 40(6): 849-962. |
| [11] | 薛一波, 张小啸, 雷加强, 李生宇, 王永东, 尤源. 北非埃及地区风蚀沙尘时空变化研究[J]. 干旱区研究, 2023, 40(6): 896-904. |
| [12] | 任丽雯, 王兴涛, 刘明春, 王大为. 石羊河流域植被净初级生产力时空变化及驱动因素[J]. 干旱区研究, 2023, 40(5): 818-828. |
| [13] | 石建周, 刘贤德, 田青, 于澎涛, 王彦辉. 六盘山半干旱区华北落叶松林坡面土壤含水量的降雨响应[J]. 干旱区研究, 2023, 40(4): 594-604. |
| [14] | 李鑫磊, 李瑞平, 王秀青, 王思楠, 王成坤. 基于地理探测器的河套灌区林草植被覆盖度时空变化与驱动力分析[J]. 干旱区研究, 2023, 40(4): 623-635. |
| [15] | 李菲菲, 周霞, 周玉玺. 西北地区农业干旱脆弱性评估及时空分布特征[J]. 干旱区研究, 2023, 40(4): 663-669. |
|
||