干旱区研究 ›› 2024, Vol. 41 ›› Issue (3): 467-479.doi: 10.13866/j.azr.2024.03.11
徐铭璟( ), 冯强(), 吕萌
收稿日期:2023-09-06
修回日期:2023-11-14
出版日期:2024-03-15
发布日期:2024-04-01
通讯作者:
冯强. E-mail: fengqiang921@163.com
作者简介:徐铭璟(1998-),女,硕士研究生,主要研究方向为生态环境管理. E-mail: 19503413673@163.com
基金资助:
XU Mingjing(), FENG Qiang(), LYU Meng
Received:2023-09-06
Revised:2023-11-14
Online:2024-03-15
Published:2024-04-01
摘要:
黄河流域山西段是重要的生态屏障区,明晰生态系统服务权衡/协同强度的时空格局,对生态保护及经济协调发展具有重要意义。本文基于生态系统服务和权衡的综合评估模型(Integrated Valuation of Ecosystem Services and Tradeoffs,InVEST)量化生态系统服务供给量和需求量,通过均方根偏差(Root Mean Square Deviation,RMSD)量化生态系统服务权衡强度,利用结构方程模型(Structural Equation Model,SEM)分析权衡强度的驱动因素。结果表明:(1) 2000—2020年产水(Water Yield,WY)和土壤保持服务(Soil Conservation,SC)、产水和固碳服务(Carbon Sequestration,CS)供给权衡强度呈上升趋势,产水和土壤保持服务、产水和固碳服务需求协同强度呈下降趋势。(2) 除产水服务在2020年供给—需求权衡强度大于0,2000—2020年产水、土壤保持和固碳服务的供给—需求权衡强度均小于0。(3) 生态系统服务权衡/协同强度主要受自然因素影响,蒸散发对产水和土壤保持服务、产水和固碳服务供给权衡具有促进作用,对产水服务供给—需求权衡具有抑制作用;草地面积占比对产水和固碳服务供给权衡及产水和土壤保持服务需求协同具有抑制作用,对固碳服务供给—需求权衡具有促进作用;降水对产水和固碳服务需求协同及土壤保持服务供给—需求权衡具有抑制作用,对产水服务供给—需求权衡具有促进作用。(4) 社会经济因素对生态系统服务权衡/协同强度具有次要作用,人口密度对产水和土壤保持服务需求协同具有促进作用,而对产水服务供给—需求权衡及固碳服务供给—需求权衡具有抑制作用。因此,在制定流域综合管理决策时应考虑生态系统服务权衡/协同强度的空间特征和驱动因素的差异性。
徐铭璟, 冯强, 吕萌. 生态系统服务权衡及其影响因素——以黄河流域山西段为例[J]. 干旱区研究, 2024, 41(3): 467-479.
XU Mingjing, FENG Qiang, LYU Meng. Tradeoffs of ecosystem services and their influencing factors: A case study of the Shanxi Section of the Yellow River Basin[J]. Arid Zone Research, 2024, 41(3): 467-479.
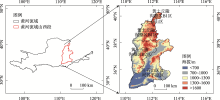
图1
研究区位置"

表1
数据来源介绍"
| 数据种类 | 数据名称 | 数据格式 | 数据时间 | 数据来源 |
|---|---|---|---|---|
| 气象数据 | 降水、蒸散发 | 栅格 | 2000年,2005年,2010年,2015年,2020年 | 国家地球系统科学数据中心 ( |
| 土壤数据 | 土壤质地、土壤有机质 | 栅格 | 2010—2018年 | 国家地球系统科学数据中心 ( |
| 土地利用数据 | 土地利用数据 | 栅格 | 2000年,2005年,2010年,2015年,2020年 | 中国科学院资源环境科学与数据中心( |
| 地形数据 | 数字高程模型(DEM) | 栅格 | 2020年 | 地理空间数据云 ( |
| 植被数据 | 归一化植被指数(NDVI) | 栅格 | 2000年,2005年,2010年,2015年,2020年 | 国家地球系统科学数据中心 ( |
| 社会经济数据 | 人口密度、国内生产总值(GDP) | 栅格 | 2000年,2005年,2010年,2015年,2020年 | 中国科学院资源环境科学与数据中心( |
| 人均收入、人均消费 | xlsx | 2000年,2005年,2010年,2015年,2020年 | 《山西统计年鉴》 ( |
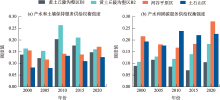
图2
产水与土壤保持、固碳服务供给权衡强度"
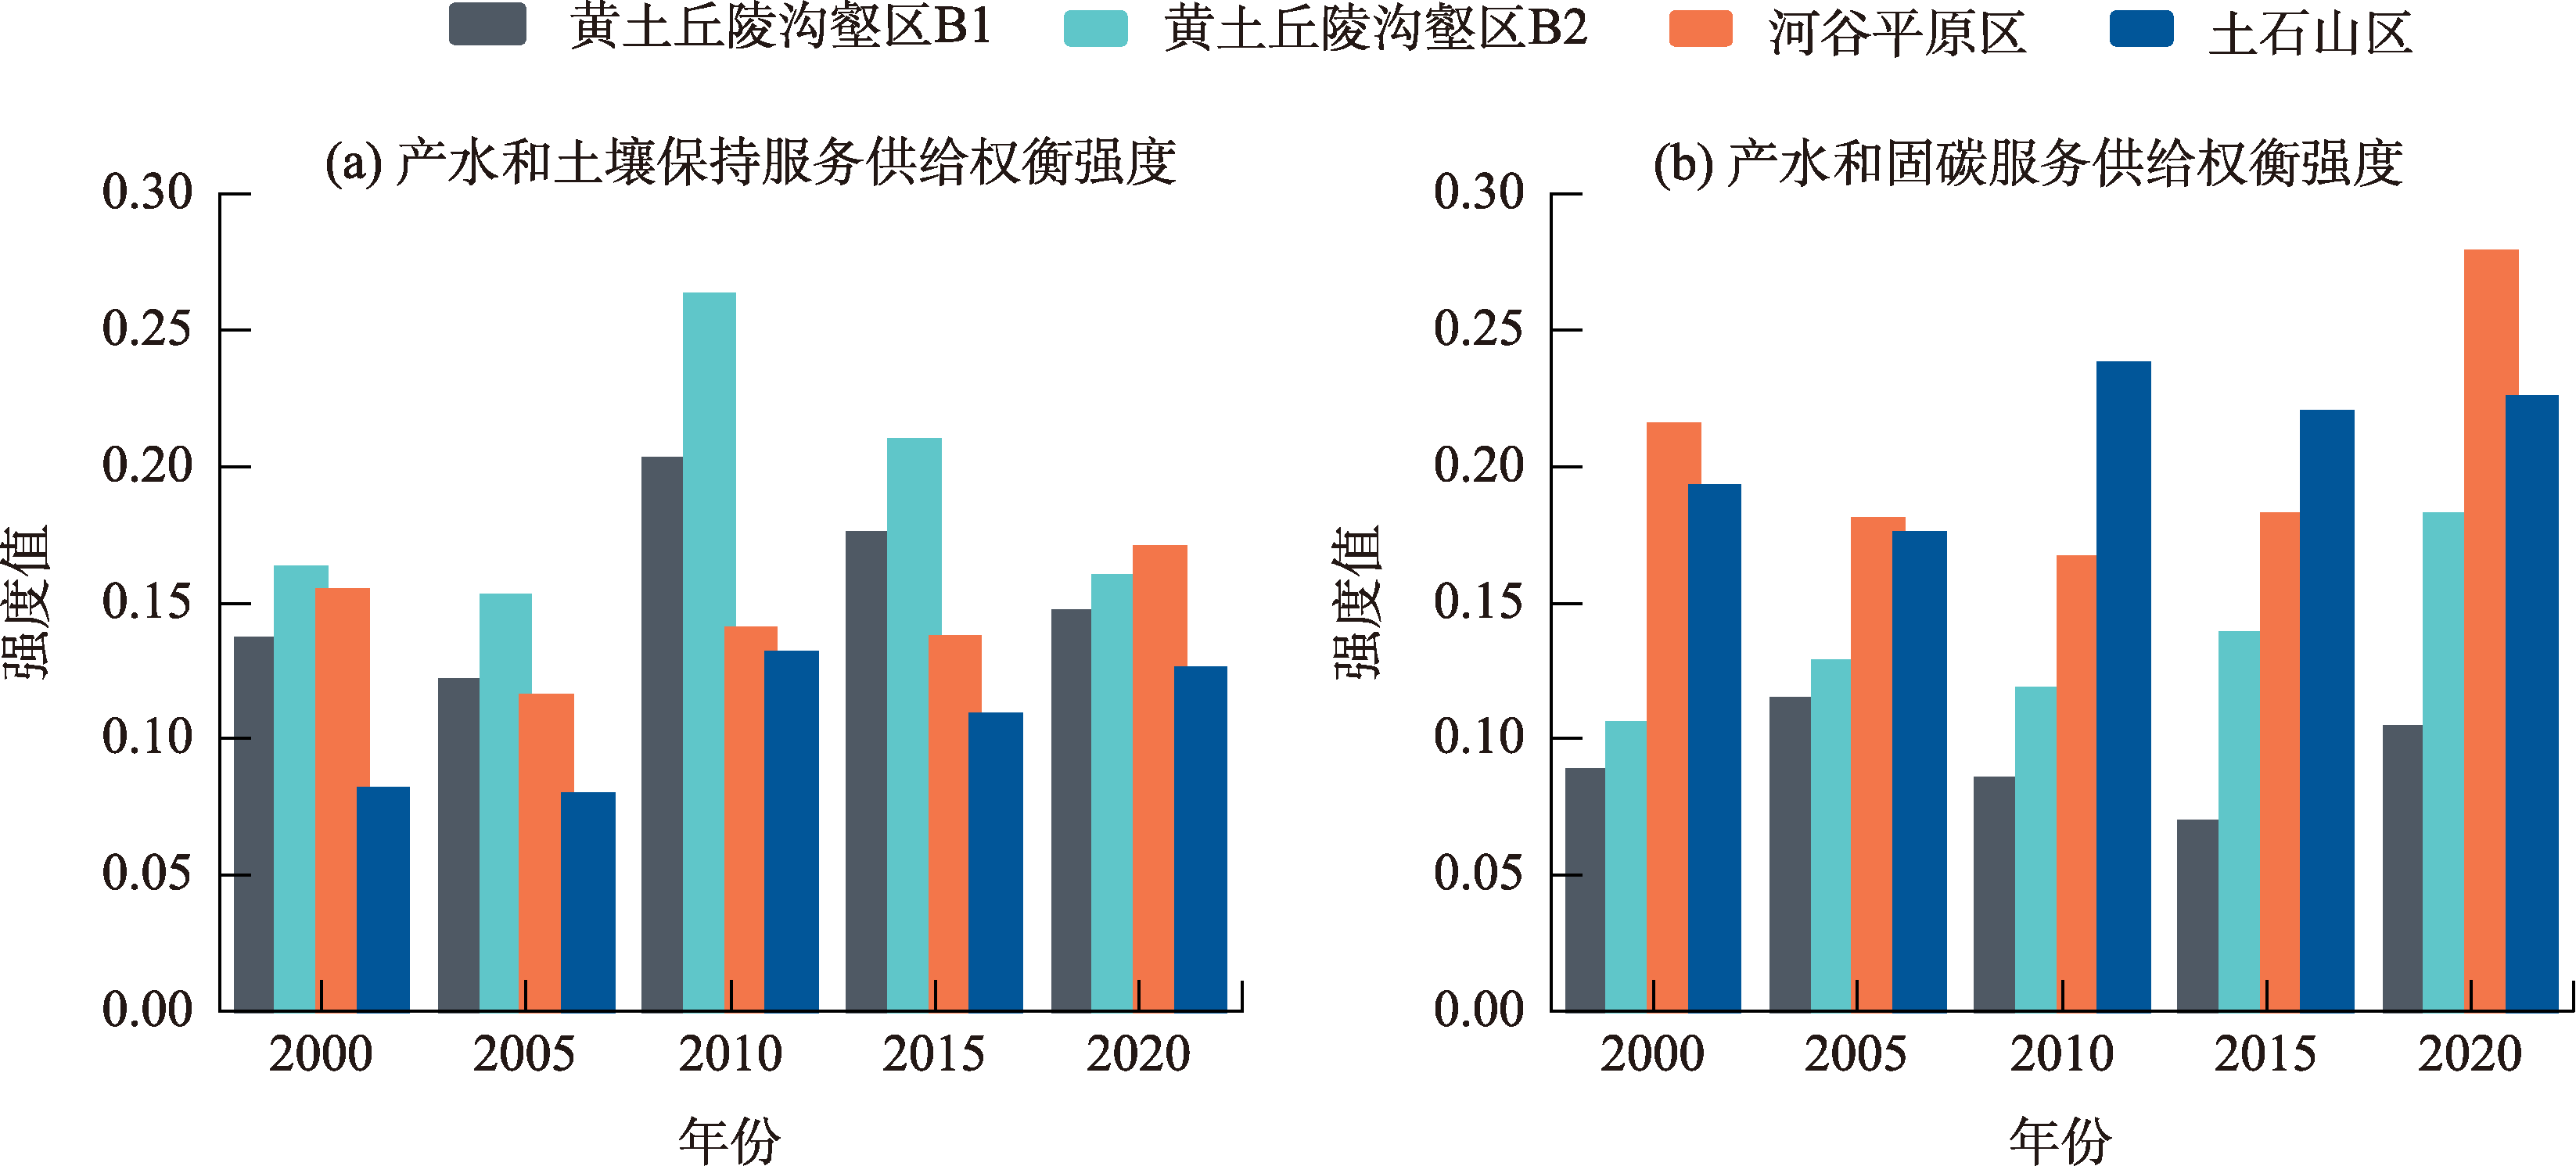
图3
产水与土壤保持、固碳服务供给权衡强度"

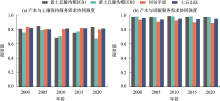
图4
产水与土壤保持、固碳服务需求协同强度"

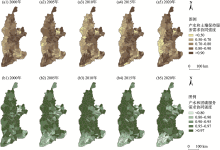
图5
产水与土壤保持、固碳服务需求协同强度"

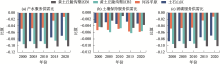
图6
产水、土壤保持、固碳服务供给-需求权衡"
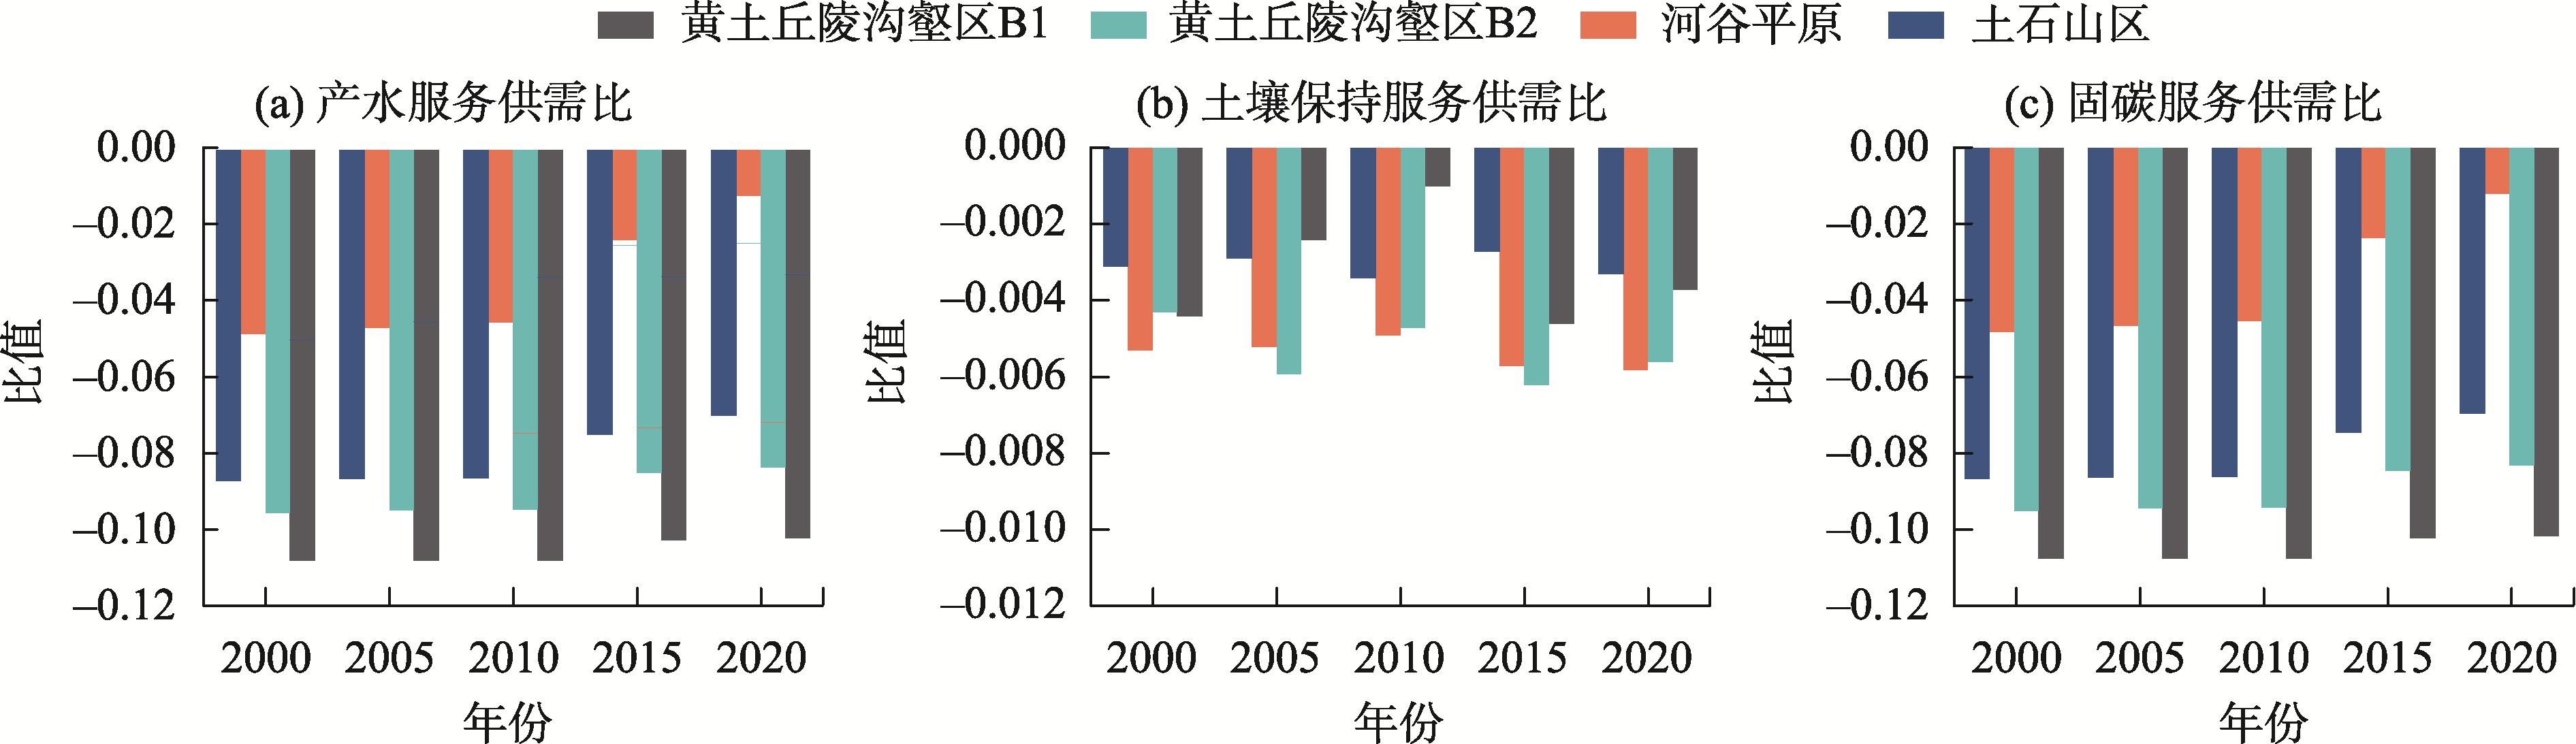

图7
产水服务与土壤保持服务、固碳服务供给-需求权衡"
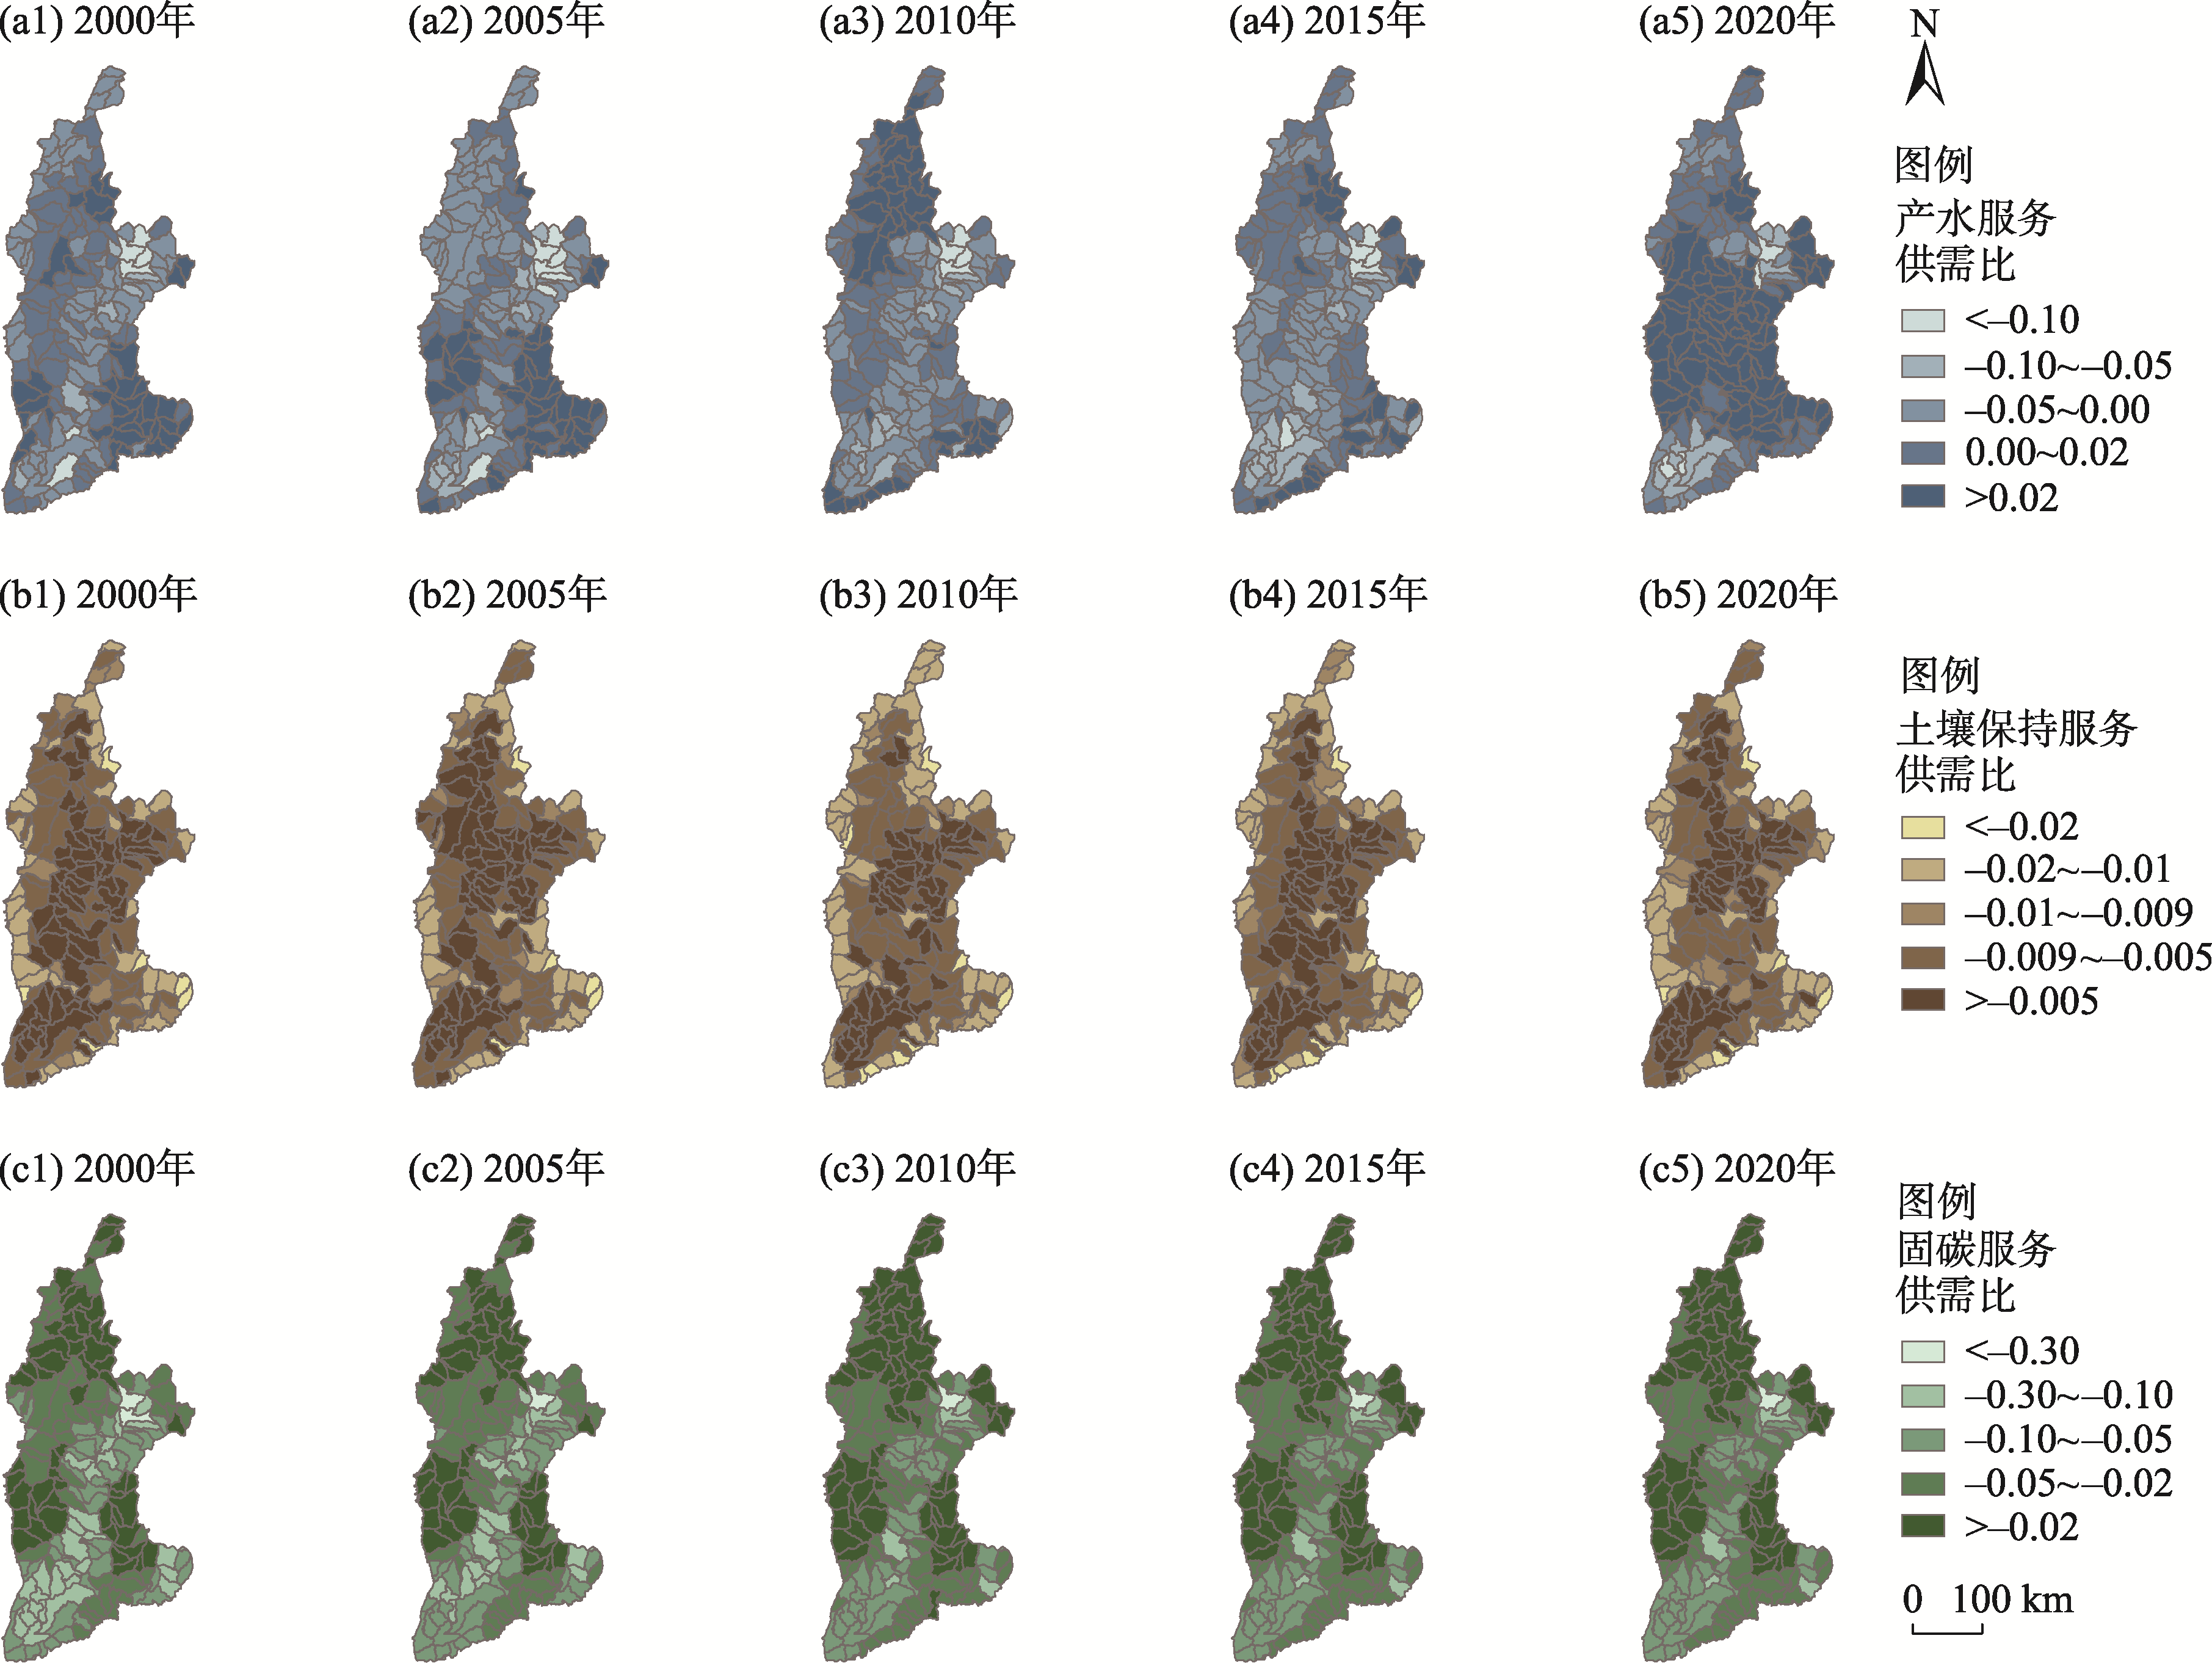
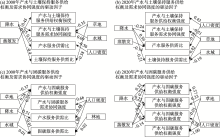
图8
各生态系统服务权衡/协同强度的驱动因子"

| [1] |
Burkhard B, Kroll F, Nedkov S, et al. Mapping ecosystem service supply, demand and budgets[J]. Ecological Indicators, 2012, 21: 17-29.
doi: 10.1016/j.ecolind.2011.06.019 |
| [2] | Redhead W J, May L, Oliver H T, et al. National scale evaluation of the InVEST nutrient retention model in the United Kingdom[J]. Science of the Total Environment, 2018, 610-611: 666-677. |
| [3] |
Wu X, Liu S, Zhao S, et al. Quantification and driving force analysis of ecosystem services supply, demand and balance in China[J]. Science of the Total Environment, 2019, 652: 1375-1386.
doi: 10.1016/j.scitotenv.2018.10.329 |
| [4] |
Hua J, Chen Y W. Prioritizing urban rivers’ ecosystem services: An importance-performance analysis[J]. Cities, 2019, 94: 11-23.
doi: 10.1016/j.cities.2019.05.014 |
| [5] | 李双成, 张才玉, 刘金龙, 等. 生态系统服务权衡与协同研究进展及地理学研究议题[J]. 地理研究, 2013, 32(8): 1379-1390. |
| [Li Shuangcheng, Zhang Caiyu, Liu Jinlong, et al. The tradeoffs and synergies of ecosystem services: Research progress, development trend, and themes of geography[J]. Geographical Research, 2013, 32(8): 1379-1390.] | |
| [6] |
Jie Z, Cheng L. Investigating ecosystem service trade-offs/synergies and their influencing factors in the Yangtze River Delta Region, China[J]. Land, 2022, 11(1): 106-106.
doi: 10.3390/land11010106 |
| [7] |
李双成, 王珏, 朱文博, 等. 基于空间与区域视角的生态系统服务地理学框架[J]. 地理学报, 2014, 69(11): 1628-1639.
doi: 10.11821/dlxb201411004 |
|
[Li Shuangcheng, Wang Yu, Zhu Wenbo, et al. Research framework of ecosystem services geography from spatial and regional perspectives[J]. Acta Geographica Sinica, 2014, 69(11): 1628-1639.]
doi: 10.11821/dlxb201411004 |
|
| [8] |
Stefano C, Richard I, Caitlin D, et al. Spatial covariance between aesthetic value other ecosystem services[J]. PloS one, 2013, 8(6): e68437.
doi: 10.1371/journal.pone.0068437 |
| [9] | 张碧天, 闵庆文, 焦雯珺, 等. 生态系统服务权衡研究进展[J]. 生态学报, 2021, 41(14): 5517-5532. |
| [Zhang Bitian, Min Qingwen, Jiao Wenjun, et al. Research progress and perspective on ecosystem services trade-offs[J]. Acta Ecologica Sinica, 2021, 41(14): 5517-5532.] | |
| [10] | Schwenk W S, Donovan T M, Keeton W S, et al. Carbon storage, timber production, and biodiversity: Comparing ecosystem services with multi-criteria decision analysis[J]. Ecological applications: A publication of the Ecological Society of America, 2012, 22(5): 1612-27. |
| [11] |
Groot C J, Yalew G S, Rossing A W. Exploring ecosystem services trade-offs in agricultural landscapes with a multi-objective programming approach[J]. Landscape and Urban Planning, 2018, 172: 29-36.
doi: 10.1016/j.landurbplan.2017.12.008 |
| [12] |
Sherrouse C B, Semmens J D, Ancona H Z, et al. Analyzing land-use change scenarios for trade-offs among cultural ecosystem services in the Southern Rocky Mountains[J]. Ecosystem Services, 2017, 26: 431-444.
doi: 10.1016/j.ecoser.2017.02.003 |
| [13] |
Xu X, Yang G, Tan Y, et al. Ecosystem services trade-offs and determinants in China’s Yangtze River Economic Belt from 2000 to 2015[J]. Science of the Total Environment, 2018, 634: 1601-1614.
doi: 10.1016/j.scitotenv.2018.04.046 |
| [14] | 韩磊, 杨梅丽, 刘钊, 等. 黄土高原典型退耕区生态系统服务权衡与协同关系研究——以延安市为例[J]. 生态学报, 2022, 42(20): 8115-8125. |
| [Han Lei, Yang Meili, Liu Zhao, et al. Ecosystem service tradeoffs and synergies in typical farmland conversion area of the Loess Plateau: Taking Yan’an City as an example[J]. Acta Ecologica Sinica, 2022, 42(20): 8115-8125.] | |
| [15] |
Tian P, Li J, Cao L, et al. Assessing matching characteristics and spatial differences between supply and demand of ecosystem services: A case study in Hangzhou, China[J]. Land, 2021, 10(6): 582-582.
doi: 10.3390/land10060582 |
| [16] | 勾蒙蒙, 刘常富, 肖文发, 等. 基于生态系统服务供需关系的长江三峡库区分区管理[J]. 陆地生态系统与保护学报, 2022, 2(4): 1-12. |
| [Gou Mengmeng, Liu Changfu, Xiao Wenfa, et al. ecological zoning management strategies based on ecosystem service supply and demand[J]. Terrestrial Ecosystem and Conservation, 2022, 2(4): 1-12.] | |
| [17] |
赵雪雁, 马平易, 李文青, 等. 黄土高原生态系统服务供需关系的时空变化[J]. 地理学报, 2021, 76(11): 2780-2796.
doi: 10.11821/dlxb202111013 |
|
[Zhao Xueyan, Ma Pingyi, Li Wenqing, et al. Spatiotemporal changes of supply and demand relationships of ecosystem services in the Loess Plateau[J]. Acta Geographica Sinica, 2021, 76(11): 2780-2796.]
doi: 10.11821/dlxb202111013 |
|
| [18] |
Zhai T, Zhang D, Zhao C. How to optimize ecological compensation to alleviate environmental injustice in different cities in the Yellow River Basin? A case of integrating ecosystem service supply, demand and flow[J]. Sustainable Cities and Society, 2021, 75: 103341.
doi: 10.1016/j.scs.2021.103341 |
| [19] |
Lin S, Wu R, Yang F, et al. Spatial trade-offs and synergies among ecosystem services within a global biodiversity hotspot[J]. Ecological Indicators, 2018, 84: 371-381.
doi: 10.1016/j.ecolind.2017.09.007 |
| [20] | 殷允可, 李昊瑞, 张铭, 等. 不同气候区生态系统服务权衡的空间异质性及其驱动因素研究——以川滇-黄土高原生态屏障带为例[J]. 生态学报, 2024, 44(1): 107-116. |
| [Yin Yunke, Li Haorui, Zhang Ming, et al. Spatial and temporal variation of ecosystem service trade-offs and drivers in different climatic zones: A case study of the ecological barrier zone of Sichuan-Yunnan-Loess Plateau[J]. Acta Ecologica Sinica, 2024, 44(1): 107-116.] | |
| [21] |
张自正, 张蕾, 孙桂英, 等. 清江流域生态系统服务权衡时空效应及驱动因素[J]. 应用生态学报, 2023, 34(4): 1051-1062.
doi: 10.13287/j.1001-9332.202304.022 |
|
[Zhang Zizheng, Zhang Lei, Sun Guiying, et al. Spatial and temporal effect and driving factors of ecosystem service trade-off in the Qingjiang River Basin, China[J]. Chinese Journal of Applied Ecology, 2023, 34(4): 1051-1062.]
doi: 10.13287/j.1001-9332.202304.022 |
|
| [22] |
Guo Shanshan, Wu Changyue, Wang Yinghong, et al. Threshold effect of ecosystem services in response to climate change, human activity and landscape pattern in the upper and middle Yellow River of China[J]. Ecological Indicators, 2022, 136: 108603.
doi: 10.1016/j.ecolind.2022.108603 |
| [23] | Guo M, Liu W F. Analysis of land use and ecosystem service values in energy-rich areas of the Yellow River basin[J]. People’s Yellow River, 2023, 45: 98-104, 110. |
| [24] | Wang Z Z, Wang H, Feng X M. An index system for assessing the comprehensive benefits of ecological restoration in key fragile ecological zones[J]. Journal of Ecology, 2019, 39: 7356-7366. |
| [25] |
Yang S, Zhao W, Liu Y, et al. Influence of land use change on the ecosystem service trade-offs in the ecological restoration area: Dynamics and scenarios in the Yanhe watershed, China[J]. Science of the Total Environment, 2018, 644: 556-566.
doi: 10.1016/j.scitotenv.2018.06.348 |
| [26] |
Chen Y, Wang K, Lin Y, et al. Balancing green and grain trade[J]. Nature Geoscience, 2015, 8(10): 739-741.
doi: 10.1038/ngeo2544 |
| [27] |
Xinzhang S, Changhui P, Guomo Z, et al. Chinese Grain for Green Program led to highly increased soil organic carbon levels: A meta-analysis[J]. Scientific Reports, 2014, 4(1): 4460.
doi: 10.1038/srep04460 |
| [28] |
Deng L, Liu G B, Shangguan Z P. Land-use conversion and changing soil carbon stocks in China’s ‘Grain-for-Green’ Program: A synthesis[J]. Global Change Biology, 2014, 20(11): 3544-56.
doi: 10.1111/gcb.12508 pmid: 24357470 |
| [29] | Liu Guobin, Li Shuxin, Chen Xiaodong, et al. Ecological and socioeconomic effects of China’s policies for ecosystem services[J]. Proceedings of the National Academy of Sciences of the United States of America, 2008, 105(28): 9477-82. |
| [30] |
Zhang B, He C, Burnham M, et al. Evaluating the coupling effects of climate aridity and vegetation restoration on soil erosion over the Loess Plateau in China[J]. Science of the Total Environment, 2016, 539: 436-449.
doi: 10.1016/j.scitotenv.2015.08.132 |
| [31] |
Bradford B J, D’Amato W A. Recognizing trade-offs in multi-objective land management[J]. Frontiers in Ecology and the Environment, 2012, 10(4): 210-216.
doi: 10.1890/110031 |
| [32] | 石亚飞, 石善恒, 黄晓敏, 等. 基于R的结构方程模型在生态学中的应用[J]. 生态学杂志, 2022, 41(5): 1015-1023. |
|
[Shi Yafei, Shi Shanheng, Huang Xiaomin, et al. The application of structural equation modeling in ecology based on R[J]. Chinese Journal of Ecology, 2022, 41(5): 1015-1023.]
doi: DOI: 10.13292/j.1000-4890.202203.016 |
|
| [33] |
Lefcheck S J. piecewiseSEM: Piecewise structural equation modelling in r for ecology, evolution, and systematics[J]. Methods in Ecology and Evolution, 2016, 7(5): 573-579.
doi: 10.1111/mee3.2016.7.issue-5 |
| [34] |
Valdés A, Lenoir J, Frenne D P, et al. High ecosystem service delivery potential of small woodlands in agricultural landscapes[J]. Journal of Applied Ecology, 2020, 57(1): 4-16.
doi: 10.1111/jpe.v57.1 |
| [35] | 马伟波, 杨帆, 王楠, 等. 长三角城市群地区生态系统服务价值时空演变及驱动因素研究[J]. 生态与农村环境学报, 2022, 38(11): 1365-1376. |
| [Ma Weibo, Yang Fan, Wang Nan, et al. Study on spatial-temporal evolution and driving factors of ecosystem service value in the Yangtze River Delta Urban Agglomerations[J]. Journal of Ecology and Rural Environment, 2022, 38(11): 1365-1376.] | |
| [36] | 张世栋. 辽河流域生态系统服务供需关系研究[D]. 延庆: 延边大学, 2021. |
| [Zhang Shidong. Study on the Relationship between Supply and Demand of Ecosystem Services in Liaohe River Basin[D]. Yanqing: Yanbian University, 2021.] | |
| [37] | 潘竟虎, 李真. 干旱内陆河流域生态系统服务空间权衡与协同作用分析[J]. 农业工程学报, 2017, 33(17): 280-289. |
| [Pan Jinghu, Li Zhen. Analysis on trade-offs and synergies of ecosystem services in arid inland river basin[J]. Transactions of the Chinese Society of Agricultural Engineering, 2017, 33(17): 280-289.] | |
| [38] |
方露露, 许德华, 王伦澈, 等. 长江、黄河流域生态系统服务变化及权衡协同关系研究[J]. 地理研究, 2021, 40(3): 821-838.
doi: 10.11821/dlyj020200044 |
|
[Fang Lulu, Xu Dehua, Wang Lunche, et al. The study of ecosystem services and the comparison of trade-off and synergy in Yangtze River Basin and Yellow River Basin[J]. Geographical Research, 2021, 40(3): 821-838.]
doi: 10.11821/dlyj020200044 |
|
| [39] |
Jia X, Fu B, Feng X, et al. The tradeoff and synergy between ecosystem services in the Grain-for-Green areas in Northern Shaanxi, China[J]. Ecological Indicators, 2014, 43: 103-113.
doi: 10.1016/j.ecolind.2014.02.028 |
| [40] | 韩永伟, 高吉喜, 王宝良, 等. 黄土高原生态功能区土壤保持功能及其价值[J]. 农业工程学报, 2012, 28(17): 78-85, 294. |
| [Han Yongwei, Gao Jixi, Wang Baoliang, et al. Evaluation of soil conservation function and its values in major eco-function areas of Loess Plateau in eastern Gansu Province[J]. Transactions of the Chinese Society of Agricultural Engineering, 2012, 28(17): 78-85, 294.] | |
| [41] |
熊昕莹, 孟梅. 基于生态系统服务供需关系及空间流动的新疆生态管理分区与优化策略[J]. 应用生态学报, 2023, 34(8): 2237-2248.
doi: 10.13287/j.1001-9332.202308.023 |
|
[Xiong Xinying, Meng Mei. Regionalization and optimization strategy of ecological management in Xinjiang, China based on supply-demand relationship and spatial flow of ecosystem services[J]. Chinese Journal of Applied Ecology, 2023, 34(8): 2237-2248.]
doi: 10.13287/j.1001-9332.202308.023 |
|
| [42] | 黄麟, 祝萍, 曹巍. 中国退耕还林还草对生态系统服务权衡与协同的影响[J]. 生态学报, 2021, 41(3): 1178-1188. |
| [Huang Lin, Zhu Ping, Cao Wei. The impacts of the Grain for Green Project on the trade-off and synergy relationships among multiple ecosystem services in China[J]. Acta Ecologica Sinica, 2021, 41(3): 1178-1188.] | |
| [43] |
Feng Q, Dong S Y, Duan B L. The effects of land-use change/conversion on trade-offs of ecosystem services in three precipitation Zones[J]. Sustainability, 2021, 13(23): 13306-13306.
doi: 10.3390/su132313306 |
| [44] |
Feng Q, Zhao W, Hu X, et al. Trading-off ecosystem services for better ecological restoration: A case study in the Loess Plateau of China[J]. Journal of Cleaner Production, 2020, 257: 120469-120469.
doi: 10.1016/j.jclepro.2020.120469 |
| [1] | 程秋连, 刘杰, 杨治纬, 张天意, 王斌. 独库高速阿尔先沟段雪崩空间分布及因子探测[J]. 干旱区研究, 2024, 41(2): 220-229. |
| [2] | 闫豫疆, 李建贵, 李均力, 蒋腾. 面向生态系统服务供需的开都-孔雀河流域生态安全格局研究[J]. 干旱区研究, 2023, 40(5): 829-839. |
| [3] | 李鑫磊, 李瑞平, 王秀青, 王思楠, 王成坤. 基于地理探测器的河套灌区林草植被覆盖度时空变化与驱动力分析[J]. 干旱区研究, 2023, 40(4): 623-635. |
| [4] | 卢雅焱,徐晓亮,李基才,冯小华,刘璐媛. 基于InVEST模型的新疆天山碳储量时空演变研究[J]. 干旱区研究, 2022, 39(6): 1896-1906. |
| [5] | 王琦琨,武玮,杨雪琪,桑国庆. 陕西省生境质量时空演变及驱动机制分析[J]. 干旱区研究, 2022, 39(5): 1684-1694. |
| [6] | 刘海龙,唐飞,丁娅楠,张羽,郭晓佳,谭景柏,程岳. 山西省县域高质量发展与生态系统服务耦合的时空演变特征[J]. 干旱区研究, 2022, 39(4): 1234-1245. |
| [7] | 冯强,赵文武,段宝玲. 生态系统服务权衡强度与供需匹配度的关联性分析——以山西省为例[J]. 干旱区研究, 2022, 39(4): 1222-1233. |
| [8] | 侯青青,陈英,裴婷婷,吉珍霞,谢保鹏. 近25 a来甘肃省耕地资源时空变化及其影响因子[J]. 干旱区研究, 2022, 39(3): 955-967. |
| [9] | 张林,张云玲,马松梅,张丹,贺凌云. 准噶尔盆地大赖草分布格局及关键因子分析[J]. 干旱区研究, 2022, 39(3): 863-871. |
| [10] | 刘畅,张红,张霄羽,杨国婷,刘勇. 半干旱地区矿区土地利用时空演变与预测[J]. 干旱区研究, 2022, 39(1): 292-300. |
| [11] | 王让会,赵文斐,彭擎,刘春伟,周丽敏,田畅. 气候变化及景观格局与生态系统碳储存的耦合关系——以祁连山为例[J]. 干旱区研究, 2022, 39(1): 250-257. |
| [12] | 排日海·合力力,昝梅,阿里木江·卡斯木. 乌鲁木齐市生态环境遥感评价及驱动因子分析[J]. 干旱区研究, 2021, 38(5): 1484-1496. |
| [13] | 吝静,赵成义,马晓飞,施枫芝,吴世新,朱建. 基于生态系统服务价值的塔里木河干流土地利用结构优化[J]. 干旱区研究, 2021, 38(4): 1140-1151. |
| [14] | 文广超,赵梅娟,谢洪波,张毅,张娟. 伊犁河谷西部土地植被覆盖演化及驱动力分析[J]. 干旱区研究, 2021, 38(3): 843-854. |
| [15] | 刘冠,李国庆,李洁,张艳如,鲁奇,杜盛. 基于InVEST模型的1999—2016年麻塔流域碳储量变化及空间格局研究[J]. 干旱区研究, 2021, 38(1): 267-274. |
|
||