干旱区研究 ›› 2023, Vol. 40 ›› Issue (12): 2031-2042.doi: 10.13866/j.azr.2023.12.15
侯文兵1,2,3( ),李开明1,2,3,4(),黄卓1,2,3
收稿日期:2023-05-27
修回日期:2023-08-29
出版日期:2023-12-15
发布日期:2023-12-18
通讯作者:
李开明. E-mail: 作者简介:侯文兵(1998-),男,硕士研究生,主要从事绿洲遥感监测及可持续发展研究. E-mail: 基金资助:
HOU Wenbing1,2,3(),LI Kaiming1,2,3,4(),HUANG Zhuo1,2,3
Received:2023-05-27
Revised:2023-08-29
Online:2023-12-15
Published:2023-12-18
摘要:
绿洲效应在改善干旱区气候,支持绿洲系统自我维持和发展等方面发挥着极为重要的作用。本文以甘肃省河西地区为研究区,利用气象和遥感数据,选取绿洲效应强度指标,采用地理探测器模型,揭示近20 a绿洲效应时空变化特征,分析了绿洲效应强度影响因素。结果表明:(1) 2000—2020年期间,研究区绿洲效应强度在春夏冬季均呈增大趋势,秋季呈减小趋势,白天与相应季节变化相似,但强度更大,最强为夏季,增加1.43 ℃;夜间春夏秋季变化与相应季节相似,但强度较低,2000年秋季和2010年冬季夜间出现微弱的绿洲暖岛效应;(2) 强绿洲效应(“冷岛”)面积占比在夏季最大且变化较小,而绿洲“暖岛”效应面积占比冬季最大,呈逐年减小趋势;(3) 夏季绿洲效应强度与绿洲的植被覆盖变化具有强负相关性,相关系数达-0.917。气候和地表因素是河西地区绿洲效应强度的主控因素,地表反照率的影响最弱,且因子间的交互作用不容忽视。
侯文兵, 李开明, 黄卓. 近20 a河西地区绿洲效应时空变化特征及归因分析[J]. 干旱区研究, 2023, 40(12): 2031-2042.
HOU Wenbing, LI Kaiming, HUANG Zhuo. Characterization of spatial and temporal changes in the oasis effect and attribution analysis of the Hexi region in the last 20 years[J]. Arid Zone Research, 2023, 40(12): 2031-2042.
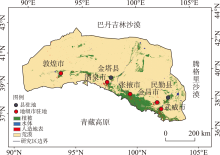
图1
研究区概况图"

表1
数据类型及来源"
| 影响因素类别 | 影响因素 | 分辨率/m | 数据时间 | 获取途径 |
|---|---|---|---|---|
| 地表因素 | NDVI | 1000 | 2020年 | GEE |
| ALB(反照率) | 500 | 2020年 | GEE | |
| GlobeLand 30 | 30 | 2000年、2010年、2020年 | http://GlobeLand30 | |
| 土壤湿度 | 1000 | 2020年 | http:// data.tpdc.ac.cn | |
| 空气质量因素 | 气溶胶光学厚度(AOD) | 1000 | 2020年 | GEE |
| 臭氧(O3) | 1000 | 2020年 | GEE | |
| 气候因素 | 气温 | 1000 | 2020年 | http:// data.tpdc.ac.cn |
| 降水 | 1000 | 2020年 | http:// data.tpdc.ac.cn | |
| 社会经济因素 | 夜间灯光 | 1000 | 2020年 | http:// data.tpdc.ac.cn |
| 人口密度 | 1000 | 2020年 | https://www.worldpop.org/ |
表2
绿洲效应强度分级及标准"
| 绿洲效应类型 | 绿洲效应强度分级 | 分级标准 |
|---|---|---|
| 绿洲“冷岛”效应 | 强绿洲效应 | LST绿洲 < LST裸地 - 8 ℃ |
| 中强度绿洲效应 | LST裸地 - 8 ℃ ≤ LST绿洲 < LST裸地 - 4 ℃ | |
| 弱绿洲效应 | LST裸地 - 4 ℃ ≤ LST绿洲 < LST裸地 | |
| 绿洲“暖岛”效应 | 绿洲暖岛效应 | LST绿洲 ≥ LST裸地 |
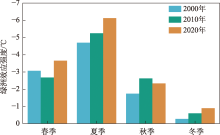
图2
2000—2020年河西绿洲不同季节绿洲效应强度变化"

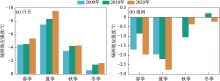
图3
绿洲效应昼夜变化"

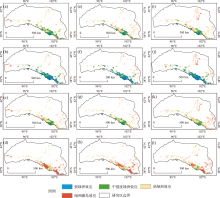
图4
河西地区2000年、2010年、2020年四季绿洲效应强度空间分布 注:(a)~(d)分别为2000年春、夏、秋、冬季;(e)~(h)分别为2010年春、夏、秋、冬季;(i)~(l)分别为2020年春、夏、秋、冬季。"

表3
绿洲效应强度面积占比"
| 季节 | 年份 | 强绿洲效应/% | 中强度绿洲效应/% | 弱绿洲效应/% | 绿洲暖岛效应/% |
|---|---|---|---|---|---|
| 春季 | 2000年 | 7.9 | 42.9 | 39.7 | 9.3 |
| 2010年 | 10.1 | 25.4 | 51.4 | 12.9 | |
| 2020年 | 7.6 | 24 | 54.9 | 13.4 | |
| 夏季 | 2000年 | 41.8 | 29.4 | 17 | 11.6 |
| 2010年 | 42.4 | 29.4 | 18.1 | 9.9 | |
| 2020年 | 41.2 | 26.5 | 15.7 | 16.4 | |
| 秋季 | 2000年 | 3.4 | 21.8 | 60 | 14.6 |
| 2010年 | 5.3 | 26.5 | 59.9 | 8.2 | |
| 2020年 | 1.7 | 20.5 | 59.2 | 18.4 | |
| 冬季 | 2000年 | 0.18 | 3.3 | 49.8 | 46.6 |
| 2010年 | 0.33 | 4.5 | 50.2 | 44.8 | |
| 2020年 | 0.03 | 7.2 | 54.1 | 38.5 |
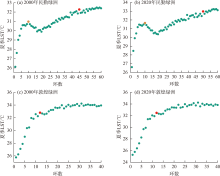
图5
2000年、2020年夏季同心圆环LST均值散点图"

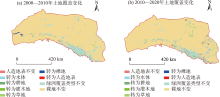
图6
河西绿洲土地覆盖的空间变化"

表4
河西绿洲土地覆盖面积变化"
| 年份 | 土地覆盖类型面积/ km2 | |||||
|---|---|---|---|---|---|---|
| 耕地 | 草地 | 灌木地 | 水体 | 人造地表 | 荒漠 | |
| 2000年 | 15170 | 20042 | 658 | 1151 | 777 | 358692 |
| 2010年 | 15670 | 19180 | 748 | 1121 | 783 | 359013 |
| 2020年 | 15835 | 22192 | 842 | 1270 | 2395 | 353871 |
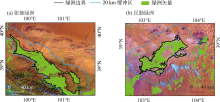
图7
绿洲和荒漠边界的范围"

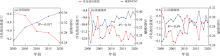
图8
绿洲植被覆盖对绿洲效应的响应"
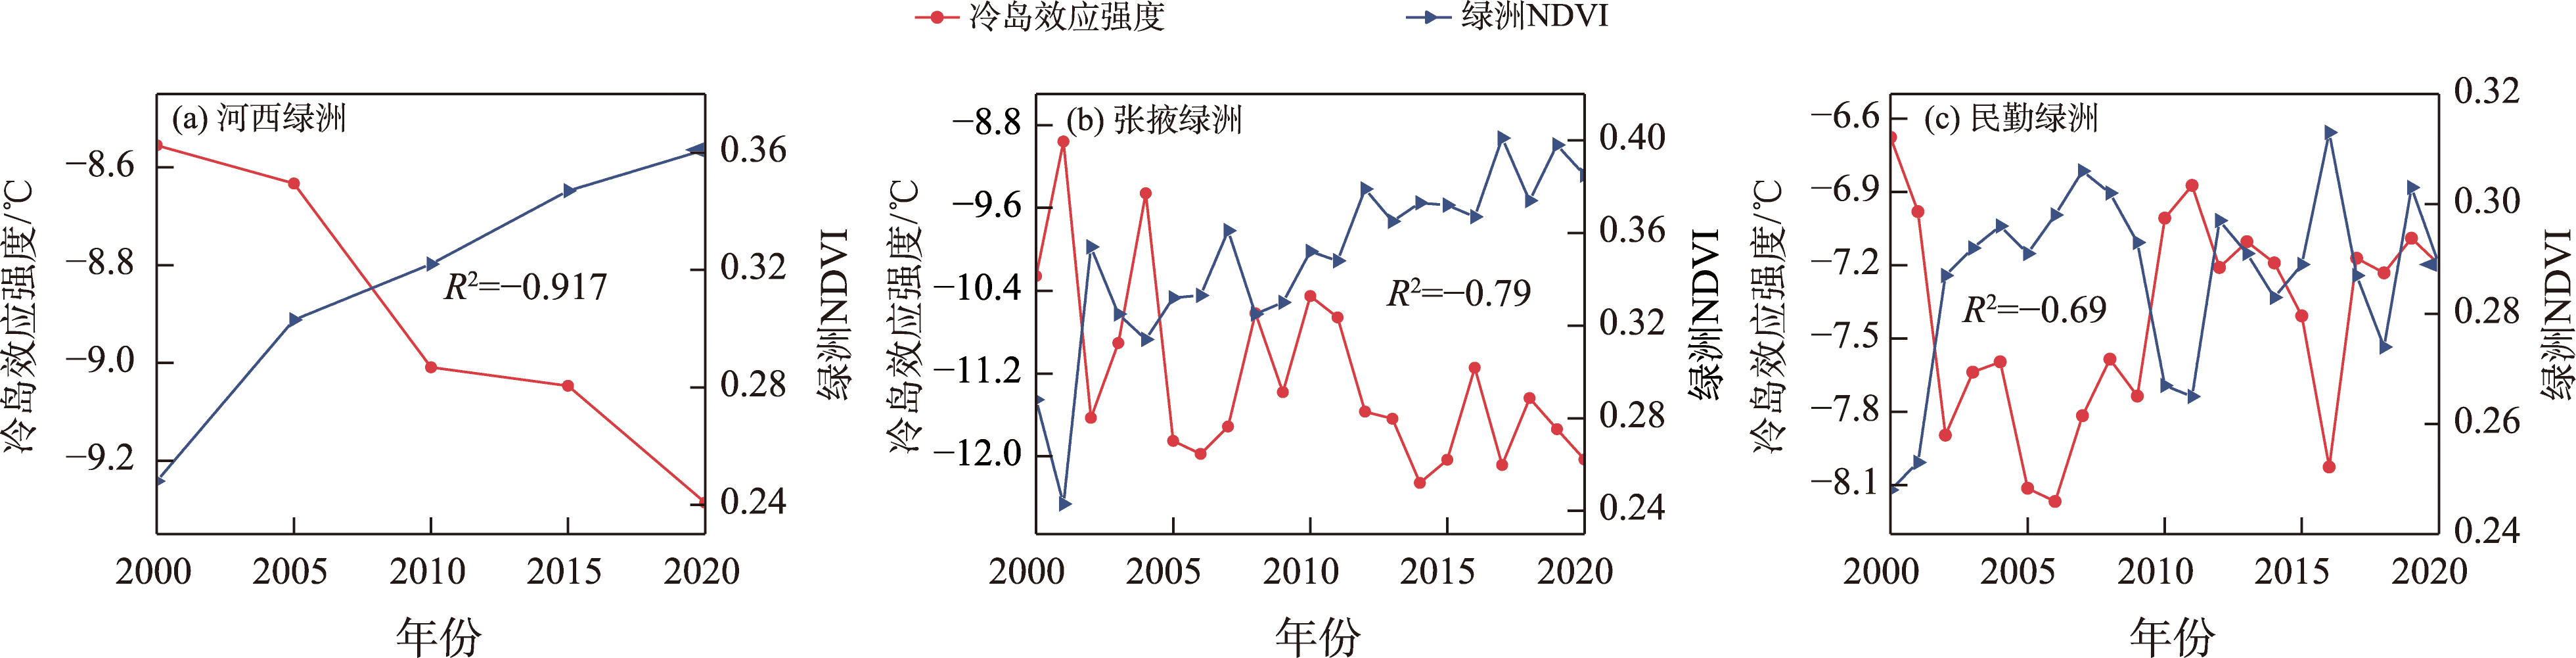
表5
绿洲效应强度驱动因素地理探测分析"
| 因子类型 | LULC | 夜间灯光 | NDVI | 降水 | 土壤湿度 | 人口密度 | ALB | AOD | O3 | 气温 |
|---|---|---|---|---|---|---|---|---|---|---|
| q统计量 | 0.214 | 0.058 | 0.276 | 0.204 | 0.162 | 0.023 | 0.013 | 0.048 | 0.064 | 0.578 |
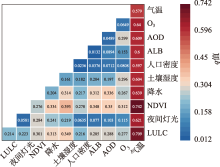
图9
2020年绿洲效应驱动因素的交互作用"

| [1] | 张强, 胡隐樵. 干旱区的绿洲效应[J]. 自然杂志, 2001, 23(4): 234-236. |
| [Zhang Qiang, Hu Yinqiao. Oasis effect in arid regions[J]. Chinese Journal of Nature, 2001, 23(4): 234-236. ] | |
| [2] | 苏从先, 胡隐樵, 张永丰, 等. 河西地区绿洲的小气候特征和“冷岛效应”[J]. 大气科学, 1987, 11(4): 390-396. |
| [Su Congxian, Hu Yinqiao, Zhang Yongfeng, et al. The microclimate character and “cold island effect” over the oasis in Hexi region[J]. Chinese Journal of Atmospheric Sciences, 1987, 11(4): 390-396. ] | |
| [3] | Oke T R. Boundary layer climates[J]. Earth Science Reviews, 1987, 27(3): 265. |
| [4] | Bie Q, Xie Y, Wang X Y, et al. Understanding the attributes of the dual oasis effect in an arid region using remote sensing and observational data[J]. Ecosystem Health and Sustainability, 2020, 6(1): 681-694. |
| [5] |
Hao X M, Li W H. Oasis cold island effect and its influence on air temperature: A case study of Tarim Basin, Northwest China[J]. Journal of Arid Land, 2016, 8(2): 172-183.
doi: 10.1007/s40333-015-0060-x |
| [6] |
Hao X M, Li W H, Deng Haijun. The oasis effect and summer temperature rise in arid regions-case study in Tarim Basin[J]. Scientific Reports, 2016, 6(1): 35418.
doi: 10.1038/srep35418 |
| [7] | 毋兆鹏, 牛苏娟, 毛敏, 等. 精河流域绿洲“冷岛效应”时空格局遥感研究[J]. 国土资源遥感, 2020, 32(3): 106-113. |
| [Wu Zhaopeng, Niu Sujuan, Mao Min, et al. Remote sensing research on the spatial-temporal pattern of “cold island effect”of oasis in Jinghe River Basin[J]. Remote Sensing for Natural Resources, 2020, 32(3): 106-113. ] | |
| [8] |
高原, 刘普幸, 姚玉龙, 等. 基于遥感的石河子绿洲冷岛效应时空变化特征及其影响因子分析[J]. 自然资源学报, 2015, 30(8): 1319-1331.
doi: 10.11849/zrzyxb.2015.08.007 |
|
[Gao Yuan, Liu Puxing, Yao Yulong, et al. Spatial-temporal characteristics and factor analysis of the cold island effect in the Shihezi oasis based on remote sensing images[J]. Journal of Natural Resources, 2015, 30(8): 1319-1331. ]
doi: 10.11849/zrzyxb.2015.08.007 |
|
| [9] |
Hao X M, Hao H C, Zhang J J. Soil moisture influenced the variability of air temperature and oasis effect in a large inland basin of an arid region[J]. Hydrological Processes, 2021, 35(6): e14246.
doi: 10.1002/hyp.v35.6 |
| [10] | 宋子奕, 鲁程鹏, 吴成城, 等. 2009—2019年河西走廊地下水位时空分布及演变趋势[J]. 水资源保护, 2023, 39(2): 160-167. |
| [Song Ziyi, Lu Chengpeng, Wu Chengcheng, et al. Spatiotemporal distribution and evolution trend of groundwater level in Hexi Corridor from 2009 to 2019[J]. Water Resources Protection, 2023, 39(2): 160-167. ] | |
| [11] | 潘莹, 崔林林, 刘昌脉, 等. 基于MODIS数据的重庆市城市热岛效应时空分析[J]. 生态学杂志, 2018, 37(12): 3736-3745. |
| [Pan Ying, Cui Linlin, Liu Changmai, et al. Spatiotemporal distribution of urban heat island effect based on MODIS data in Chongqing, China[J]. Chinese Journal of Ecology, 2018, 37(12): 3736-3745. ] | |
| [12] |
伍健恒, 孙彩歌, 樊风雷. 西藏地表温度时空演变特征及影响因子[J]. 冰川冻土, 2022, 44(5): 1523-1538.
doi: 10.7522/j.issn.1000-0240.2022.0135 |
|
[Wu Jianheng, Sun Caige, Fan Fenglei. Spatiotemporal evolution characteristics and influencing factors of land surface temperature(LST)in Tibet[J]. Journal of Glaciology and Geocryology, 2022, 44(5): 1523-1538. ]
doi: 10.7522/j.issn.1000-0240.2022.0135 |
|
| [13] | 巩杰, 谢余初, 高彦净, 等. 1963—2009年金塔绿洲变化对绿洲景观格局的影响[J]. 生态学报, 2015, 35(3): 603-612. |
| [Gong Jie, Xie Yuchu, Gao Yanjing, et al. Spatio-temporal change and its effects on landscape pattern of Jinta oasis in arid China from 1963 to 2009[J]. Acta Ecologica Sinica, 2015, 35(3): 603-612. ] | |
| [14] | 吕利利, 颉耀文, 张秀霞, 等. 1986—2015年瓜州绿洲变化[J]. 生态学报, 2017, 37(16): 5482-5491. |
| [Lv Lili, Xie Yaowen, Zhang Xiuxia, et al. Changes in Guazhou oases between 1986 and 2015[J]. Acta Ecologica Sinica, 2017, 37(16): 5482-5491. ] | |
| [15] |
张强, 胡隐樵. 绿洲地理特征及其气候效应[J]. 地球科学进展, 2002, 17(4): 477-486.
doi: 10.11867/j.issn.1001-8166.2002.04.0477 |
|
[Zhang Qiang, Hu Yinqiao. The geographicalfeatures and climatic effects of oasis[J]. Advances in Earth Science, 2002, 17(4): 477-486. ]
doi: 10.11867/j.issn.1001-8166.2002.04.0477 |
|
| [16] |
Liang S L. Narrowband to broadband conversions of land surface albedo I: Algorithms[J]. Remote Sensing of Environment, 2001, 76(2): 213-238.
doi: 10.1016/S0034-4257(00)00205-4 |
| [17] | 李午阳, 兰鑫灿, 唐家乐, 等. 地表反照率和蒸散发对秦巴山地增温效应的影响[J]. 山地学报, 2022, 40(4): 614-625. |
| [Li Wuyang, Lan Xincan, Tang Jiale, et al. Influence of albedo and evapotranspiration on the mass elevation effect in the Qinling-Daba Mountains of China[J]. Mountain Research, 2022, 40(4): 614-625. ] | |
| [18] | 张秀, 王旭红, 郑玉蓉, 等. 气溶胶光学厚度和不透水地表覆盖度对城市热岛强度的影响——以关中地区为例[J]. 生态学报, 2021, 41(22): 8965-8976. |
| [Zhang Xiu, Wang Xuhong, Zheng Yurong, et al. Effects of aerosol optical depth and impervious surface percentage on urban heat island intensity: A case study in Guanzhong Region[J]. Acta Ecologica Sinica, 2021, 41(22): 8965-8976. ] | |
| [19] |
乔治, 田光进. 基于MODIS的2001—2012年北京热岛足迹及容量动态监测[J]. 遥感学报, 2015, 19(3): 476-484.
doi: 10.11834/jrs.20154165 |
|
[Qiao Zhi, Tian Guangjin. Dynamic monitoring of the footprint and capacity for urban heat island in Beijing between 2001 and 2012 based on MODIS[J]. National Remote Sensing Bulletin, 2015, 19(3): 476-484. ]
doi: 10.11834/jrs.20154165 |
|
| [20] |
李双双, 张玉凤, 张立伟, 等. 2000—2019年秦岭南北实际蒸散发时空变化特征[J]. 地理科学进展, 2021, 40(11): 1900-1910.
doi: 10.18306/dlkxjz.2021.11.009 |
|
[Li Shuangshuang, Zhang Yufeng, Zhang Liwei, et al. Spatio-temporal variation of actual evapotranspiration in the south and north of the Qinling Mountains during 2000-2019[J]. Progress in Geography, 2021, 40(11): 1900-1910. ]
doi: 10.18306/dlkxjz.2021.11.009 |
|
| [21] | 郝嘉楠, 高泽阳. 城市景观格局与地表温度的定量关系——以兰州市为例[J]. 商丘师范学院学报, 2020, 36(9): 50-54. |
| [Hao Jianan, Gao Zeyang. Quantitative relationship between urban landscape pattern and surface temperature-taking Lanzhou City as an Example[J]. Journal of Shangqiu Normal University, 2020, 36(9): 50-54. ] | |
| [22] |
王劲峰, 徐成东. 地理探测器:原理与展望[J]. 地理学报, 2017, 72(1): 116-134.
doi: 10.11821/dlxb201701010 |
|
[Wang Jingfeng, Xu Chengdong. Geodetector: Principle and prospective[J]. Acta Geographica Sinica, 2017, 72(1): 116-134. ]
doi: 10.11821/dlxb201701010 |
|
| [23] | 王爽, 王承武, 张飞云. 基于FSDAF模型的干旱区典型绿洲城市夏季地表热岛效应时空演变研究[J]. 干旱区地理, 2021, 44(1): 118-130. |
| [Wang Shuang, Wang Chengwu, Zhang Feiyun. Spatiotemporal variations of the summer daytime surface urban heat island of oasis city in arid area based on FSDAF model[J]. Arid Land Geography, 2021, 44(1): 118-130. ] | |
| [24] | 徐满厚, 刘彤. 绿洲-荒漠过渡带早春自然植被的物种组成及其防风效应[J]. 干旱区研究, 2012, 29(1): 64-72. |
| [Xu Manhou, Liu Tong. Species composition and windproof effect of natural vegetation at an oasis-desert ecotone in early spring[J]. Arid Zone Research, 2012, 29(1): 64-72. ] | |
| [25] | 王君厚, 周士威, 路兆明, 等. 乌兰布和荒漠人工绿洲小气候效应研究[J]. 干旱区研究, 1998, 15(1): 27-34. |
| [Wang Junhou, Zhou Shiwei, Lu Zhaoming, et al. Studies on the local climate effect of the artificial oasis in the Ulan Buh Desert[J]. Arid Zone Research, 1998, 15(1): 27-34. ] | |
| [26] | 方创琳. 河西走廊: 绿洲支撑着城市化!——与仲伟志先生商榷[J]. 中国沙漠, 2003, 23(3): 128-130. |
| [Fang Chuanglin. Hexi Corridor: Oasis supporting urbanization!—Discussing with Mr. ZHONG Weizhi[J]. Journal of Desert Research, 2003, 23(3): 128-130. ] | |
| [27] | 宋晓辉, 金净, 阿拉塔. 在干旱半干旱地区种植旱生牧草华北驼绒藜的建议[J]. 当代畜禽养殖业, 2022(5): 59-60. |
| [Song Xiaohui, Jin Jing, A Lata. Proposal for cultivation of the arid forage North China camelina in arid and semi-arid areas[J]. Modern Animal Husbandry, 2022(5): 59-60. ] | |
| [28] | 安志山, 张克存, 谭立海, 等. 论沙漠-绿洲过渡带的风沙防护效应[J]. 干旱区研究, 2017, 34(5): 1196-1202. |
| [An Zhishan, Zhang Kecun, Tan Lihai, et al. Effect of protection against wind-drift sand over desert-oasis ecotone[J]. Arid Zone Research, 2017, 34(5): 1196-1202. ] | |
| [29] | 马勇刚, 贡璐, 丁建丽. 塔里木南缘绿洲“冷岛”效应时空变化研究——以于田地区为例[J]. 中国沙漠, 2007, 27(5): 866-869. |
| [Ma Yonggang, Gong Lu, Ding Jianli. Spatial-temporal change of “Cool Island” effect in southern Tarim Basin: A case study in Yutian Oasis[J]. Journal of Desert Research, 2007, 27(5): 866-869. ] | |
| [30] | 潘竟虎, 张伟强. 张掖绿洲冷岛效应时空格局的遥感分析[J]. 干旱区研究, 2010, 27(4): 481-486. |
| [Pan Jinghu, Zhang Weiqiang. Remote sensing analysis of the spatial-temporal pattern of "Cold Island" effect of Zhangye Oasis[J]. Arid Zone Research, 2010, 27(4): 481-486. ] | |
| [31] | 别强. 干旱区绿洲效应及影响因素研究——以河西地区为例[D]. 兰州: 兰州大学, 2021. |
| [Bie Qiang. The Characteristics and Influencing Factors of Oasis Effect-A Case Study in Hexi Oasis[D]. Lanzhou: Lanzhou University, 2021. ] | |
| [32] | 鲁晖, 董敬儒, 贺思嘉, 等. 2000—2017年河西地区山地-绿洲-荒漠系统植被变化趋势与可持续性分析[J]. 兰州大学学报(自然科学版), 2021, 57(1): 99-108. |
| [Lu Hui, Dong Jingru, He Sijia, et al. Vegetation change trend and persistence analysis of the mountainoasis-desert system in Hexi region from 2000 to 2017[J]. Journal of Lanzhou University(Natural Sciences), 2021, 57(1): 99-108. ] | |
| [33] | 林纾, 李红英, 党冰, 等. 甘肃河西走廊地区气候暖湿转型后的最新事实[J]. 冰川冻土, 2014, 36(5): 1111-1121. |
| [Lin Shu, Li Hongying, Dang Bing, et al. The latest evidences of a warm-wet climatic shift in Hexi Corridor, Gansu[J]. Journal of Glaciology and Geocryology, 2014, 36(5): 1111-1121. ] | |
| [34] |
胡晓萌, 张鑫, 雒舒琪, 等. 甘肃省不同气候区1961—2020年蒸散发时空变化及其影响因子[J]. 节水灌溉, 2022(11): 73-78.
doi: 10.12396/jsgg.2022104 |
|
[Hu Xiaomeng, Zhang Xin, Luo Shuqi, et al. Temporal and spatial changes of potential evapotranspiration and its influencing factors in different climatic regions of Gansu Province from 1961 to 2020[J]. Water Saving Irrigation, 2022(11): 73-78. ]
doi: 10.12396/jsgg.2022104 |
|
| [35] |
朱秉启. 中纬度荒漠区河西走廊沙丘地貌的演化特征及其环境指示[J]. 地理学报, 2021, 76(11): 2710-2729.
doi: 10.11821/dlxb202111009 |
|
[Zhu Bingqi. The recent evolution of dune landforms and its environmental indications in the mid-latitude desert area (Hexi Corridor)[J]. Acta Geographica Sinica, 2021, 76(11): 2710-2729. ]
doi: 10.11821/dlxb202111009 |
|
| [36] | 李锦超, 曹春, 方锋, 等. 基于卫星和地面监测的河西走廊O3浓度时空分布及潜在源区分析[J]. 环境科学, 2023, 44(9): 4785-4798. |
| [Li Jinchao, Cao Chun, Fang Feng, et al. Temporal and spatial distribution of O3 concentration and potential source area analysis of Hexi Corridor based on satellite and ground monitoring[J]. Environmental Science, 2023, 44(9): 4785-4798. ] | |
| [37] | 邹易, 蒙吉军. 干旱区绿洲-城镇-荒漠景观演变及生态环境效应[J]. 干旱区研究, 2023, 40(6): 988-1001. |
| [Zou Yi, Meng Jijun. Evaluation of an oasis-urban-desert landscape and the related eco-environmental effects in an arid area[J]. Arid Zone Research, 2023, 40(6): 988-1001. ] | |
| [38] | 赵文智, 任珩, 杜军, 等. 河西走廊绿洲生态建设和农业发展的若干思考与建议[J]. 中国科学院院刊, 2023, 38(3): 424-434. |
| [Zhao Wenzhi, Ren Heng, Du Jun, et al. Thoughts and suggestions on oasis ecological construction and agricultural development in Hexi Corridor[J]. Bulletin of Chinese Academy of Sciences, 2023, 38(3): 424-434. ] | |
| [39] | 马柱国, 符淙斌, 谢力, 等. 土壤湿度和气候变化关系研究中的某些问题[J]. 地球科学进展, 2001, 16(4): 563-568. |
| [Ma Zhuguo, Fu Congbin, Xie Li, et al. Some problems in the study on the relationship between soil moisture and climatic change[J]. Advances in Earth Science, 2001, 16(4): 563-568. ] | |
| [40] | 任丽雯, 王兴涛, 刘明春, 等. 石羊河流域植被净初级生产力时空变化及驱动因素[J]. 干旱区研究, 2023, 40(5): 818-828. |
| [Ren Liwen, Wang Xingtao, Liu Mingchun, et al. Temporal and spatial changes and the driving factors of vegetation NPP in Shiyang River Basin[J]. Arid Zone Research, 2023, 40(5): 818-828. ] | |
| [41] | 刘子龙, 代斌, 崔卓彦, 等. 大气污染物浓度变化特征及潜在源分析——以乌鲁木齐为例[J]. 干旱区研究, 2021, 38(2): 562-569. |
| [Liu Zilong, Dai Bin, Cui Zhuoyan, et al. Concentration char-acteristics and potential source of atmospheric pollutants: A case study in Urumqi[J]. Arid Zone Research, 2021, 38(2): 562-569. ] |
| [1] | 刘一丹, 姚晓军, 李宗省, 胡家瑜. 气候变化和土地利用覆盖变化对河西地区植被净初级生产力的影响[J]. 干旱区研究, 2024, 41(1): 169-180. |
| [2] | 胡广录,陶虎,焦娇,白元儒,陈海志,麻进. 黑河中游正义峡径流变化趋势及归因分析[J]. 干旱区研究, 2023, 40(9): 1414-1424. |
| [3] | 文妙霞, 何学高, 刘欢, 张婧, 罗晨, 贾丰铭, 王义贵, 胡云云. 基于地理探测器的宁夏草地植被覆被时空分异及驱动因子[J]. 干旱区研究, 2023, 40(8): 1322-1332. |
| [4] | 李虹, 李忠勤, 陈普晨, 彭加加. 近20 a新疆阿尔泰山积雪时空变化及其影响因素[J]. 干旱区研究, 2023, 40(7): 1040-1051. |
| [5] | 王士维, 孙栋元, 周敏, 王亦可, 王祥镔, 季宗虎, 张文睿, 武兰珍. 1951—2020年疏勒河流域气温时空变化特征[J]. 干旱区研究, 2023, 40(7): 1065-1074. |
| [6] | 赵卓怡, 郝兴明. 基于Priestley-Taylor方法的中亚干旱区实际蒸散特征及归因[J]. 干旱区研究, 2023, 40(7): 1085-1093. |
| [7] | 齐润泽, 潘竟虎. 河湟地区生态脆弱性时空演变及影响因素研究[J]. 干旱区研究, 2023, 40(6): 1002-1013. |
| [8] | 刘笑, 郭鹏, 祁佳峰, 杜文玲, 张茹倩, 张坤. 基于MRSEI模型的阿勒泰市生态环境时空变化及驱动力分析[J]. 干旱区研究, 2023, 40(6): 1014-1026. |
| [9] | 薛一波, 张小啸, 雷加强, 李生宇, 王永东, 尤源. 北非埃及地区风蚀沙尘时空变化研究[J]. 干旱区研究, 2023, 40(6): 896-904. |
| [10] | 任丽雯, 王兴涛, 刘明春, 王大为. 石羊河流域植被净初级生产力时空变化及驱动因素[J]. 干旱区研究, 2023, 40(5): 818-828. |
| [11] | 吕锦心, 梁康, 刘昌明, 张仪辉, 刘璐. 无定河流域土地覆被空间分异机制及相关水碳变量变化[J]. 干旱区研究, 2023, 40(4): 563-572. |
| [12] | 李鑫磊, 李瑞平, 王秀青, 王思楠, 王成坤. 基于地理探测器的河套灌区林草植被覆盖度时空变化与驱动力分析[J]. 干旱区研究, 2023, 40(4): 623-635. |
| [13] | 康利刚, 曹生奎, 曹广超, 杨羽帆, 严莉, 王有财. 青海湖沙柳河流域蒸散发时空变化特征[J]. 干旱区研究, 2023, 40(3): 358-372. |
| [14] | 马浩文, 王永芳, 郭恩亮. 基于GEE的翁牛特旗土地沙漠化遥感监测[J]. 干旱区研究, 2023, 40(3): 504-516. |
| [15] | 徐涛,于欢,孔博,邱霞,胡孟珂,凌鹏飞. 藏北高原砾石粒径空间异质性研究[J]. 干旱区研究, 2023, 40(2): 292-302. |
|
||