干旱区研究 ›› 2022, Vol. 39 ›› Issue (6): 1810-1818.doi: 10.13866/j.azr.2022.06.11
尹明财( ),朱豪,胡圆昭,李振中,张济世()
收稿日期:2022-04-20
修回日期:2022-08-21
出版日期:2022-11-15
发布日期:2023-01-17
通讯作者:
张济世
作者简介:尹明财(1995-),男,硕士研究生,主要研究方向为水文水资源. E-mail: 基金资助:
YIN Mingcai(),ZHU Hao,HU Yuanzhao,LI Zhenzhong,ZHANG Jishi()
Received:2022-04-20
Revised:2022-08-21
Online:2022-11-15
Published:2023-01-17
Contact:
Jishi ZHANG
摘要:
利用STIRPAT模型分析了灰水足迹的驱动因素,研究了甘肃省2011—2020年的灰水足迹变化。结果表明:在这10 a间灰水足迹整体下降,下降了378.53
尹明财,朱豪,胡圆昭,李振中,张济世. 甘肃省灰水足迹变化特征及驱动因素[J]. 干旱区研究, 2022, 39(6): 1810-1818.
YIN Mingcai,ZHU Hao,HU Yuanzhao,LI Zhenzhong,ZHANG Jishi. Analysis of various characteristics and driving factors of gray water footprint in Gansu Province[J]. Arid Zone Research, 2022, 39(6): 1810-1818.
表1
2011—2020年甘肃省污水排放量、污染物排放量、水资源量、经济数据"
| 年份 | 污水排放量/104 t | 污染物排放量/104 t | 水资源量/108 m3 | GDP/108元 | ||||
|---|---|---|---|---|---|---|---|---|
| 生活污水 | 工业污水 | 生活COD | 工业COD | 总氮 | ||||
| 2011 | 59477 | 10218 | 10 | 0.45 | 3.6 | 410.88 | 9016.7 | |
| 2012 | 59718 | 10409 | 11.23 | 0.87 | 1.28 | 325.88 | 8718.3 | |
| 2013 | 59478 | 10539 | 11.35 | 0.96 | 1.37 | 354.89 | 8104.1 | |
| 2014 | 54003 | 10426 | 11.31 | 1.39 | 1.35 | 280.79 | 7336.7 | |
| 2015 | 53283 | 13022 | 13.82 | 1.74 | 1.59 | 209.56 | 6907.9 | |
| 2016 | 48275 | 18760 | 14.66 | 8.36 | 5.13 | 198.81 | 6556.6 | |
| 2017 | 46209 | 19742 | 14.41 | 8.86 | 5.12 | 230.84 | 6518.4 | |
| 2018 | 44769 | 20171 | 14.54 | 9.05 | 4.74 | 303.209 | 6014.5 | |
| 2019 | 43589 | 19188 | 14.99 | 9.3 | 4.75 | 300.69 | 5393.1 | |
| 2020 | 39491 | 19720 | 15.23 | 9.61 | 5.19 | 272.14 | 4816.9 | |
| 均值 | 50829.20 | 15219.50 | 13.15 | 5.07 | 3.41 | 288.77 | 6938.32 | |
表2
畜禽粪便污染物进入水体流失率"
| 项目 | 牛粪 | 猪粪 | 羊粪 | 家禽粪 | 牛猪尿 |
|---|---|---|---|---|---|
| COD | 6.16 | 5.58 | 5.50 | 8.59 | 50 |
| BOD | 4.87 | 6.14 | 6.70 | 6.78 | 50 |
| NH3-N | 2.22 | 3.04 | 4.10 | 4.15 | 50 |
| TP | 5.50 | 5.25 | 5.20 | 8.42 | 50 |
| TN | 5.68 | 5.34 | 5.30 | 8.47 | 50 |

图1
2011—2020年甘肃省灰水足迹变化"
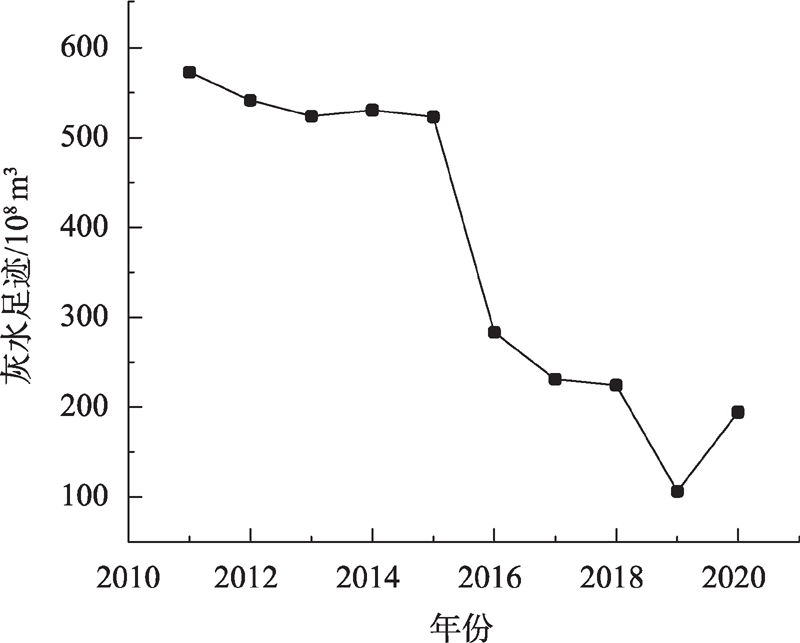

图2
2011—2020年甘肃省人均灰水足迹变化"
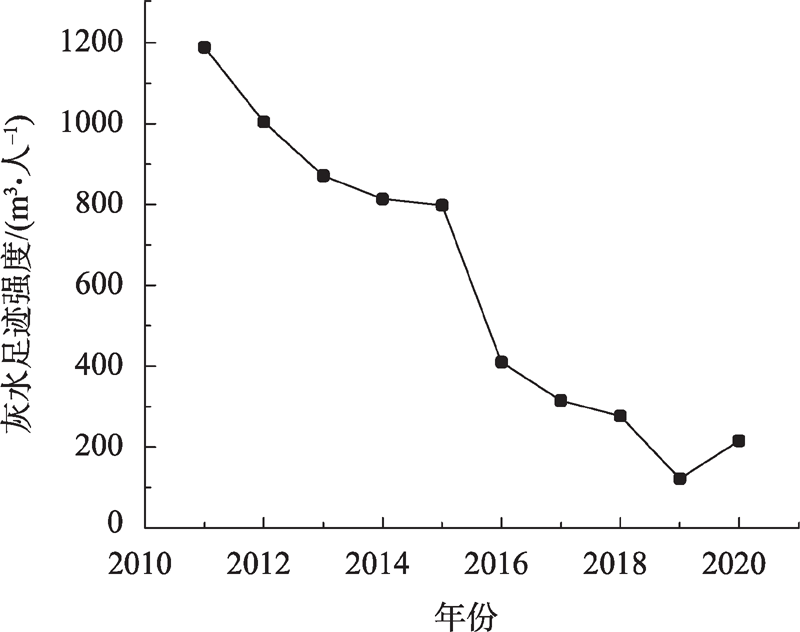
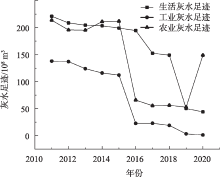
图3
2011—2020年甘肃省灰水足迹结构"


图4
2011—2020年甘肃省灰水足迹强度变化"
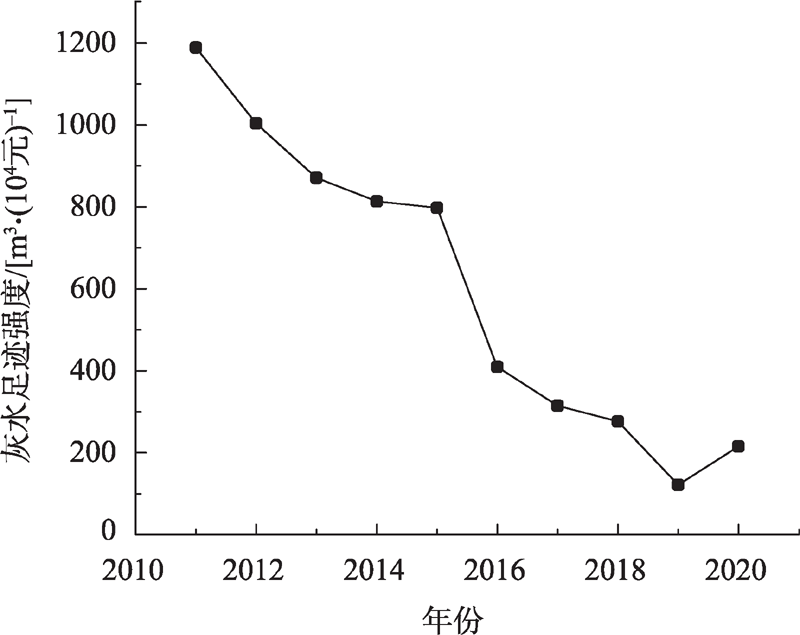
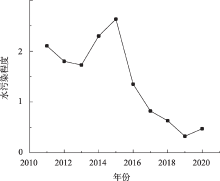
图5
2011—2020年甘肃省水污染变化程度"


图6
2011—2020年甘肃省剩余灰水足迹变化"
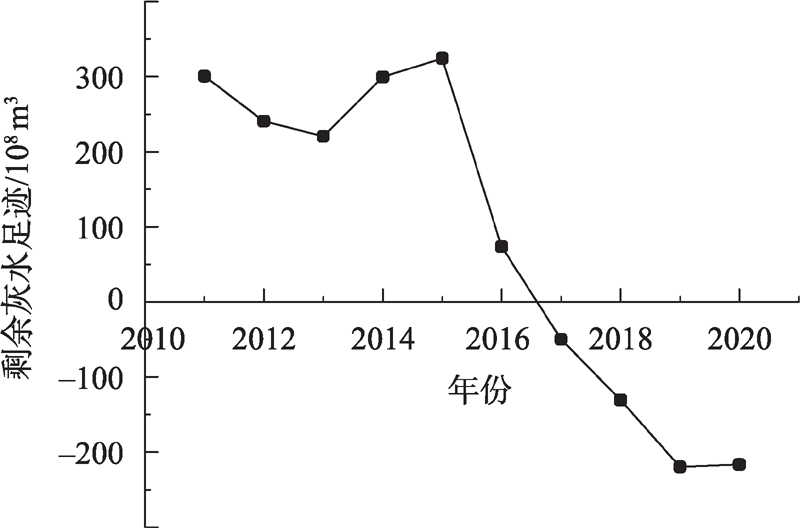
表3
变量描述"
| 变量名称 | 计算方法 | 符号 |
|---|---|---|
| 灰水足迹/108 m3 | 各年灰水足迹 | Y |
| 人口/104人 | 各年人口数量 | X1 |
| 城镇化水平/% | 城镇人口占总人口比例 | X2 |
| 人均GDP/(元·人-1) | 各年人均 GDP | X3 |
| 第一产业产值/108元 | 提供生产物资材料的产业 | X4 |
| 第二产业产值/108元 | 加工、制造产业 | X5 |
| 第三产业产值/108元 | 商业、餐饮业、金融保险业等非物质生产部门 | X6 |
| 灰水足迹强度/﹝m3·(104 元)-1﹞ | 水资源效率变化状况 | X7 |
| 社会消费品零售总额/104 元 | 指城乡居民用于生活消费的商品金额 | X8 |
表4
最小二乘法回归系数"
| 模型 | 非标准化系数 | 标准化系数 | t | Sig | 共线性 | |||
|---|---|---|---|---|---|---|---|---|
| 弹性系数B | 标准误差 | 试用版 | 容差 | VIF | ||||
| 变量 | -14.697 | 42.908 | -0.343 | 0.765 | ||||
| lnX2 | -3.412 | 5.912 | -0.092 | -0.577 | 0.622 | 0.006 | 161.101 | |
| lnX3 | 4.427 | 1.880 | 2.100 | 2.354 | 0.143 | 0.000 | 5092.938 | |
| lnX4 | -.580 | 0.699 | -0.494 | -0.830 | 0.494 | 0.000 | 2265.950 | |
| lnX5 | 1.901 | 0.540 | 0.504 | 3.519 | 0.072 | 0.008 | 131.477 | |
| lnX6 | 6.131 | 1.518 | 3.811 | 4.039 | 0.056 | 0.000 | 5696.821 | |
| lnX7 | 5.417 | 0.953 | 2.450 | 5.682 | 0.030 | 0.001 | 1190.048 | |
| lnX8 | -0.081 | 0.027 | -0.253 | -3.016 | 0.095 | 0.022 | 44.982 | |

图7
岭迹图"
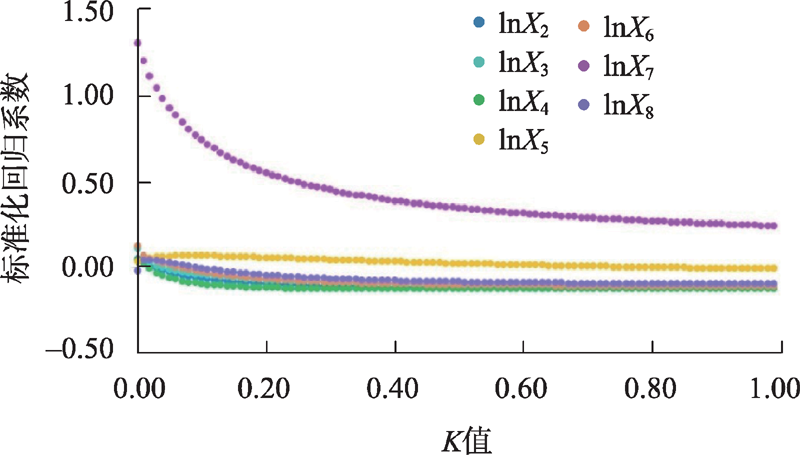
表5
岭回归模型汇总"
| 模型汇总 | |||
|---|---|---|---|
| 样本量 | R2 | 调整R2 | 模型误差RMSE |
| 10 | 0.999 | 0.994 | 0.02 |
表6
岭回归模型 ANOVA 表格"
| ANOVA表格 | |||||
|---|---|---|---|---|---|
| 平方和 | df | 均方 | F | P值 | |
| 回归 | 3.063 | 7 | 0.438 | 217.867 | 0.005 |
| 残差 | 0.004 | 2 | 0.002 | ||
| 总计 | 3.067 | 9 | |||
表7
Ridge回归分析结果"
| 非标准化系数 | 标准化系数 | t | P | R2 | 调整R2 | F | ||
|---|---|---|---|---|---|---|---|---|
| B | 标准误 | Beta | ||||||
| 常数 | -7.829 | 2.812 | - | -2.784 | 0.108 | 0.999 | 0.994 | F(7,2) =217.867 Sig F =0.005 |
| lnX2 | 0.142 | 0.385 | 0.028 | 0.37 | 0.747 | |||
| lnX3 | 0.126 | 0.096 | 0.045 | 1.34 | 0.322 | |||
| lnX4 | 0.052 | 0.215 | 0.023 | 0.243 | 0.83 | |||
| lnX5 | 0.382 | 0.283 | 0.049 | 1.348 | 0.31 | |||
| lnX6 | 0.132 | 0.088 | 0.07 | 1.506 | 0.271 | |||
| lnX7 | 0.916 | 0.051 | 1.203 | 17.974 | 0.003** | |||
| lnX8 | 0.1 | 0.215 | 0.042 | 0.464 | 0.688 | |||
| [1] | 沈满洪, 陈庆能. 水资源经济学[M]. 北京: 中国环境科学出版社, 2008. |
| [ Shen Manhong, Chen Qingneng. Water Economics[M]. Beijing: China Environmental Press, 2008. ] | |
| [2] | 王雅, 冼超凡, 欧阳志云. 基于灰水足迹的中国城市水资源可持续利用综合评价[J]. 生态学报, 2021, 41(8): 2983-2995. |
| [ Wang Ya, Xian Chaofan, Ouyang Zhiyun. Integrated assessment of sustainability in urban water resources utilization in China based on grey water footprint[J]. Acta Ecologica Sinica, 2021, 41(8): 2983-2995. ] | |
| [3] | 许程程. 甘肃省水资源承载力评价研究[D]. 兰州: 兰州财经大学, 2021. |
| [ Xu Chengcheng. Research on Evaluation of Water Resources Carrying Capacity in Gansu Province[D]. Lanzhou: Lanzhou University of Finance and Economics, 2021. ] | |
| [4] | 李向, 管涛, 徐清. 基于BP神经网络的土壤重金属污染评价方法——以包头土壤环境质量评价为例[J]. 中国农学通报, 2012, 28(2): 250-256. |
| [ Li Xiang, Guan Tao, Xu Qing. The evaluation of soil heavy metal pollution based on the BP neural network: Taking soil environmental quality assessment in Baotou as an example[J]. Chinese Agricultural Science Bulletin, 2012, 28(2): 250-256. ] | |
| [5] | 景朝霞, 夏军, 张翔, 等. 汉江中下游干流水质状况时空分布特征及变化规律[J]. 环境科学研究, 2019, 32(1): 104-115. |
| [ Jing Zhaoxia, Xia Jun, Zhang Xiang, et al. Spatial and temporal distribution and variation of water quality in the middle and downstream of Hanjiang River[J]. Research of Environmental Sciences, 2019, 32(1): 104-115. ] | |
| [6] | 吴钢, 蔡井伟, 付海威, 等. 模糊综合评价在大伙房水库下游水污染风险评价中应用[J]. 环境科学, 2007, 11(3): 2438-2441. |
| [ Wu Gang, Cai Jingwei, Fu Haiwei, et al. Application of fuzzy comprehensive assessment in risk assessment of water pollution conditions in downriver area of Dahuofang Reservoir[J]. Environmental Science, 2007, 11(3): 2438-2441. ] | |
| [7] | 曾昭, 刘俊国. 北京市灰水足迹评价[J]. 自然资源学报, 2013, 28(7): 1169-1178. |
| [ Zeng Zhao, Liu Junguo. Historical trend of grey water footprint of Beijing, China[J]. Journal of Natural Resources, 2013, 28(7): 1169-1178. ] | |
| [8] | 申浩, 陈致君, 刘健, 等. 山东省灰水足迹区域均衡性分析[J]. 节水灌溉, 2022(3): 1-7. |
| [ Sheng Hao, Chen Zhiqun, Liu Jian, et al. Analysis of the regional equilibrium of grey water footprint in Shandong Province[J]. Water Saving Irrigation, 2022(3): 1-7. ] | |
| [9] | Hoekstra A Y, Chapagain A K. Globalization of Water: Sharing the Planet’s Freshwater Resources[M]. Oxford: Wiley-Blackwell, 2008. |
| [10] | Hoekstra A Y, Chapagain A K, Aldaya M M, et al. The Water Footprint Assessment Manual: Setting the Global Standard[M]. London: Earthscan, 2011:30- 40. |
| [11] | 傅春, 陈毓迪, 刘业忠, 等. 江西省农田灰水足迹时空分析[J]. 农业环境科学学报, 2022, 41(7): 1501-1508. |
| [ Fu Chun, Chen Yudi, Liu Yezhong, et al. Temporal and spatial analysis of grey water footprint in Jiangxi Province farmland[J]. Journal of Agro-Environment Science, 2022, 41(7): 1501-1508. ] | |
| [12] | 罗勇. 赣江流域灰水足迹时空演变特征研究[D]. 南昌: 南昌大学, 2021. |
| [ Luo Yong. Study on the Temporal and Spatial Evolution Characteristics of Grey Water Footprint in Ganjiang River Basin[D]. Nanchang: Nanchang University, 2021. ] | |
| [13] | 贺志文, 向平安. 湖南省灰水足迹变化特征及其驱动因子分析[J]. 中国农村水利水电, 2018(10): 19-26. |
| [ He Zhiwen, Xiang Pingan. An analysis of the variations and driving factors of grey water footprint in Hunan Province[J]. China Rural Water and Hydropower, 2018(10): 19-26. ] | |
| [14] | 钱秀红. 杭嘉湖平原农业非点源污染的调查评价及控制对策研究[D]. 杭州: 浙江大学, 2001. |
| [ Qian Xiuhong. Investigation, Evaluation and Control Countermeasures of Agricultural Non-point Source Pollution in Hangjiahu Plain[D]. Hangzhou: Zhejiang University, 2001. ] | |
| [15] | 李飞, 董锁成. 西部地区畜禽养殖污染负荷与资源化路径研究[J]. 资源科学, 2011, 33(11): 2204-2211. |
| [ Li Fei, Dong Suocheng. Pollution from livestock and poultryand. its resource strategy in West China[J]. Resources Science, 2011, 33(11): 2204-2211. ] | |
| [16] | 李中桂, 高利珍. 基于水足迹理论的污水处理厂评估[J]. 环境工程学报, 2017, 11(3): 1599-1604. |
| [ Li Zhonggui, Gao Lizhen. Water footprint assessment in wastewater treatment plants[J]. Chinese Journal of Environmental Engineering, 2017, 11(3): 1599-1604. ] | |
| [17] | 王晓萌, 黄凯, 杨顺顺, 等. 中国产业部门水足迹演变及其影响因素分析[J]. 自然资源学报, 2014, 29(12): 2114-2126. |
| [ Wang Xiaomeng, Huang Kai, Yang Shunshun, et al. Temporal variability and influencing factors of sectoral water footprint in China[J]. Journal of Natural Resources, 2014, 29(12): 2114-2126. ] | |
| [18] |
Ehrlich P R, Holden J P. Impact of population growth[J]. Science, 1971, 171: 1212-1217.
pmid: 5545198 |
| [19] | Dietz T, Rosa E A. Rethinking the environmental impacts of population, affluence and technology[J]. Human Ecology Review, 1994, 1: 277-300. |
| [20] |
York R, Rosa E A, Dietz T. STIRPAT, IPAT and ImPACT: analytic tools for unpacking the driving forces of environmental impacts[J]. Ecological economics, 2003, 46(3): 351-365.
doi: 10.1016/S0921-8009(03)00188-5 |
| [21] | 张郁, 张峥, 苏明涛. 基于化肥污染的黑龙江垦区粮食生产灰水足迹研究[J]. 干旱区资源与环境, 2013, 27(7): 28-32. |
| [ Zhang Yu, Zhang Zheng, Su Mingtao. Research on grey water footprint based on chemical fertilizer use in the grain production in Heilongjiang reclamation area[J]. Journal of Arid Land Resources and Environment, 2013, 27(7): 28-32. ] | |
| [22] |
Wu Bo, Zeng Weihua, Chen Honghan, et al. Grey water footprint combined with ecological network analysis for assessing regional water quality metabolism[J]. Journal of Cleaner Production, 2016, 112: 3138-3151.
doi: 10.1016/j.jclepro.2015.11.009 |
| [23] |
Li Y, Lu L, Tan Y, et al. Decoupling water consumption and environmental impact on textile industry by using water footprint method: A case study in China[J]. Water, 2017, 9(2): 124.
doi: 10.3390/w9020124 |
| [24] | 国家环境保护总局自然生态保护司. 全国规模化畜禽养殖业污染情况调查及防治对策[M]. 北京: 中国环境科学出版社, 2002. |
| [ Department of Natural Ecology Protection, State Environmental Protection Administration. Investigation on the Pollution Situation of National Large-scale Livestock and Poultry Breeding Industry and Countermeasures for Prevention and Control[M]. Beijing: China Environmental Press, 2002. ] | |
| [25] | 全国污染源普查水产养殖业污染源产排污系数测算项目组. 第一次全国污染源普查水产养殖业污染源产排污系数手册[M]. 北京: 中国水产科学研究院, 2009. |
| [ National Pollution Source Census Aquaculture Industry Pollution Source Production and Discharge Coefficient Calculation Project Team. The First National Pollution Source Census Aquaculture Industry Pollution Source Production Sewage Coefficient Manual[M]. Beijing: Chinese Academy of Fishery Sciences, 2009. ] | |
| [26] | 杨楠. 岭回归分析在解决多重共线性问题中的独特作用[J]. 统计与决策, 2004(3): 14-15. |
| [ Yang Nan. The unique role of ridge regression analysis in solving multicollinearity problems[J]. Statistics & Decision, 2004(3): 14-15. ] | |
| [27] | 张丽丽. 基于STIRPAT模型的建筑业碳排放影响因素分析[D]. 西安: 西安建筑科技大学, 2020. |
| [ Zhang Lili. Analysis of Carbon Emission Factors in Construction Industry Based on STIRPAT Model[D]. Xi’an: Xi’an University of Architecture and Technology, 2020. ] | |
| [28] | 李允洁. 杭州市灰水足迹研究[D]. 浙江: 浙江师范大学, 2017. |
| [ Li Yunjie. Research on Grey Water Footprint in Hangzhou[D]. Zhejiang: Zhejiang Normal University, 2017. ] |
| [1] | 刘一丹, 姚晓军, 李宗省, 胡家瑜. 气候变化和土地利用覆盖变化对河西地区植被净初级生产力的影响[J]. 干旱区研究, 2024, 41(1): 169-180. |
| [2] | 周子涵, 王基鑫, 刘维成, 王勇, 张君霞, 郭润霞. 甘肃省暖季降水日变化特征[J]. 干旱区研究, 2024, 41(1): 1-12. |
| [3] | 杜慧娟, 王光耀, 冉光妍, 吕密. 面向SDGs的塔里木河流域农业灰水足迹分析[J]. 干旱区研究, 2023, 40(7): 1184-1193. |
| [4] | 任丽雯, 王兴涛, 刘明春, 王大为. 石羊河流域植被净初级生产力时空变化及驱动因素[J]. 干旱区研究, 2023, 40(5): 818-828. |
| [5] | 陈加伟, 褚建民, 甘红豪, 徐磊, 公帅, 刘浩, 王迎新, 杨洪晓, 徐晓庆, 齐丹卉. 浑善达克沙地长梗扁桃群丛特征及其驱动因素分析[J]. 干旱区研究, 2023, 40(5): 777-784. |
| [6] | 张昊琛,萨楚拉,孟凡浩,罗敏,王牧兰,高红豆. 内蒙古地表冻融指数动态变化与驱动因素分析[J]. 干旱区研究, 2022, 39(6): 1996-2008. |
| [7] | 姚佳,陈启慧,李琼芳,崔罡,张良憬. 伊犁河—巴尔喀什湖流域实际蒸散发时空变化特征及其环境影响因子[J]. 干旱区研究, 2022, 39(5): 1564-1575. |
| [8] | 冯强,赵文武,段宝玲. 生态系统服务权衡强度与供需匹配度的关联性分析——以山西省为例[J]. 干旱区研究, 2022, 39(4): 1222-1233. |
| [9] | 侯青青,陈英,裴婷婷,吉珍霞,谢保鹏. 近25 a来甘肃省耕地资源时空变化及其影响因子[J]. 干旱区研究, 2022, 39(3): 955-967. |
| [10] | 张丽丽,邓晓雅,龙爱华,高海峰,任才,李志赟. 基于农业水足迹的水资源安全时空变化分析——以新疆和田地区为例[J]. 干旱区研究, 2022, 39(2): 436-447. |
| [11] | 王晓峰,延雨,李月皓,张兴,符鑫鑫. 银川市湿地景观演变及其驱动因素[J]. 干旱区研究, 2021, 38(3): 855-866. |
| [12] | 白壮壮, 崔建新, 丁晓辉. 1986—2015年鄂尔多斯高原沙漠化及其驱动因素研究[J]. 干旱区研究, 2020, 37(3): 749-. |
| [13] | 杨涵, 陈学刚, 王亚奇. 1990—2010年新疆额尔齐斯河流域湿地景观动态变化[J]. 干旱区研究, 2013, 30(2): 211-218. |
| [14] | 汪宝龙, 张明军, 魏军林, 黄小燕, 王圣杰. 1960-2009年甘肃省极端气温的变化[J]. 干旱区研究, 2012, 29(4): 674-680. |
|
||