干旱区研究 ›› 2021, Vol. 38 ›› Issue (6): 1514-1523.doi: 10.13866/j.azr.2021.06.03 cstr: 32277.14.AZR.20210603
王振1,2( ),李均力1,3(),包安明1,3,张久丹1,2,白洁1,3
收稿日期:2021-03-28
修回日期:2021-07-17
出版日期:2021-11-15
发布日期:2021-11-29
作者简介:王振(1995-),男,硕士研究生,主要从事干旱区水资源与湖泊变化机理研究. E-mail: 基金资助:
WANG Zhen1,2(),LI Junli1,3(),BAO Anming1,3,ZHANG Jiudan1,2,BAI Jie1,3
Received:2021-03-28
Revised:2021-07-17
Published:2021-11-15
Online:2021-11-29
摘要:
巴里坤湖是天山东部山间内陆封闭型湖泊,了解巴里坤湖的演变特征对于开展湖泊保护与生态环境治理具有重要意义。利用308景Landsat系列和Sentinel 2遥感影像提取1995—2020年湖泊水面的时间序列,并结合巴里坤气象站资料以及从遥感影像上提取的耕地面积数据,分析湖泊在气候变化与人类活动影响下的变化趋势。结果表明:湖泊变化经历了2个阶段:1995—2006年萎缩,从年均值57.33 km2下降到35.53 km2,下降速率1.98 km2·a-1,萎缩35.79%;2006—2020年扩张,从年均值35.53 km2上升到46.59 km2,上升速率0.79 km2·a-1,扩张31.12%。多年湖泊面积的月变化统计表明:湖泊在5月达到最大值(73.09±21.01)km2,11月达到最小值(43.90±16.97)km2。影响因素:1995—2006年,降水变化幅度较小,农业用水与蒸发量增加是巴里坤湖萎缩的主要原因;2006年后,巴里坤县出台多种湿地保护措施,耕地面积扩张趋势得到控制,降水显著增加与蒸发量减少成为湖泊面积扩张的主要原因。
王振,李均力,包安明,张久丹,白洁. 1995—2020年新疆巴里坤湖面积时序变化及归因[J]. 干旱区研究, 2021, 38(6): 1514-1523.
WANG Zhen,LI Junli,BAO Anming,ZHANG Jiudan,BAI Jie. Temporal variation in the Barkol Lake area and its driving factors in 1995-2020[J]. Arid Zone Research, 2021, 38(6): 1514-1523.

图1
研究区示意图"


图2
1995—2020年研究区多源遥感数据分布"

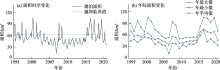
图3
1995—2020年巴里坤湖面积变化"

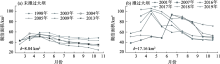
图4
巴里坤湖月面积变化"


图5
巴里坤湖水面边界空间变化特征"
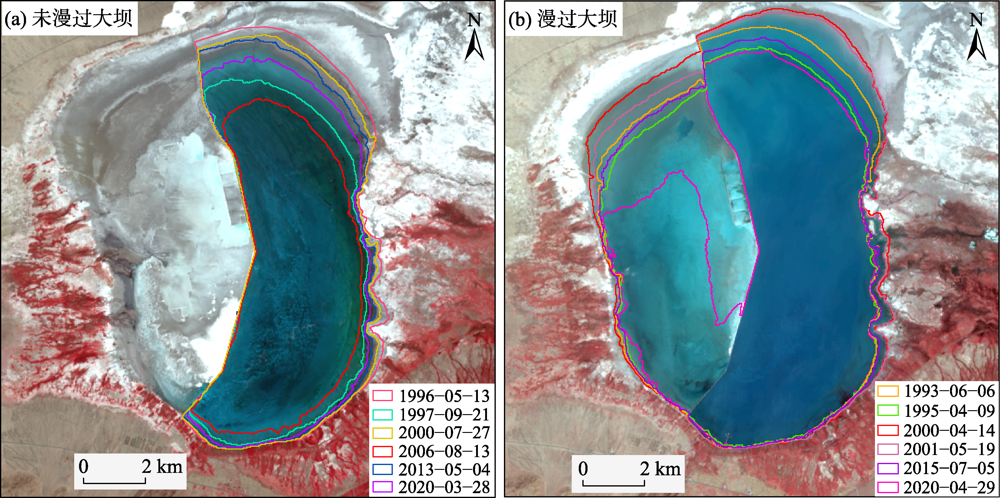

图6
1990—2020年巴里坤站降水变化趋势及M-K统计量变化"

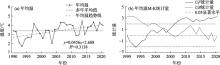
图7
1990—2020年巴里坤站气温变化趋势与M-K统计量变化"

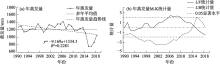
图8
1990—2018年巴里坤站蒸发量变化趋势与M-K统计量变化"


图9
1995—2020年耕地面积空间分布频率"

表1
巴里坤湖水面面积与影响因子的Pearson相关系数"
| 参数 | 时段 | 降水 | 温度 | 蒸发量 | 耕地面积 |
|---|---|---|---|---|---|
| Pearson相关系数 | 1995—2020年 | 0.373 | -0.135 | -0.659** | -0.102 |
| 1995—2006年 | 0.184 | -0.513 | -0.726** | -0.744** | |
| 2007—2020年 | 0.529* | -0.139 | -0.836** | 0.461 |
| [1] | 秦伯强, 张运林. 西部湖泊资源的开发与生态环境保护[J]. 中国科学院院刊, 2001, 16(1):21-25. |
| [ Qin Boqiang, Zhang Yunlin. The resource exploitation and eco-environment protection of lakes in Western China[J]. Bulletin of Chinese Academy of Sciences, 2001, 16(1):21-25. ] | |
| [2] |
Zhang F, Tiyip T, Johnson V C, et al. The influence of natural and human factors in the shrinking of the Ebinur Lake, Xinjiang, China, during the 1972-2013 period[J]. Environmental Monitoring Assessment, 2015, 187(1):4128.
doi: 10.1007/s10661-014-4128-4 |
| [3] |
Yang J M, Ma L G, Liu C Z, et al. Temporal-spatial variations and influencing factors of Lakes in inland arid areas from 2000 to 2017: A case study in Xinjiang[J]. Geomatics, Natural Hazards and Risk, 2019, 10(1):519-543.
doi: 10.1080/19475705.2018.1531942 |
| [4] | 王莺, 闫正龙, 高凡. 1957—2015年红碱淖湖水域面积时空变化监测及驱动力分析[J]. 农业工程学报, 2018, 34(2):265-271. |
| [ Wang Ying, Yan Zhenglong, Gao Fan. Monitoring spatio-temporal changes of water area in Hongjiannao Lake from 1957 to 2015 and its driving forces analysis[J]. Transactions of the CSAE, 2018, 34(2):265-271. ] | |
| [5] |
Wurtsbaugh W A, Miller C, Null S E, et al. Decline of the world’s saline lakes[J]. Nature Geoscience, 2017, 10(11):816-821.
doi: 10.1038/ngeo3052 |
| [6] |
Mahmood R, Jia S. Assessment of hydro-climatic trends and causes of dramatically declining stream flow to Lake Chad, Africa, using a hydrological approach[J]. Science of The Total Environment, 2019, 675:122-140.
doi: 10.1016/j.scitotenv.2019.04.219 |
| [7] |
Yu H L, Tu Z F, Yu G M, et al. Shrinkage and protection of inland lakes on the regional scale: A case study of Hubei Province, China[J]. Regional Environmental Change, 2020, 20(1):4.
doi: 10.1007/s10113-020-01594-w |
| [8] | 魏学. 近45 a达里诺尔湖面积演变对气候的响应[J]. 干旱区资源与环境, 2019, 33(2):110-115. |
| [ Wei Xue. Response of Dali Lake area to climate factors in the past 45 years[J]. Journal of Arid Land Resources and Environment, 2019, 33(2):110-115. ] | |
| [9] |
Wang J D, Sheng Y W, Tong T S D. Monitoring decadal lake dynamics across the Yangtze Basin downstream of Three Gorges Dam[J]. Remote Sensing of Environment, 2014, 152:251-269.
doi: 10.1016/j.rse.2014.06.004 |
| [10] | 闫立娟, 郑绵平. 我国蒙新地区近40年来湖泊动态变化与气候耦合[J]. 地球学报, 2014, 35(4):463-472. |
| [ Yan Lijuan, Zheng Mianping. Dynamic changes of lakes in Inner Mongolia-Xinjiang Region and the climate interaction in the past forty years[J]. Acta Geoscientica Sinica, 2014, 35(4):463-472. ] | |
| [11] |
Yang X W, Wang N L, Chen A A, et al. Changes in area and water volume of the Aral Sea in the arid Central Asia over the period of 1960-2018 and their causes[J]. Catena, 2020, 191:104566.
doi: 10.1016/j.catena.2020.104566 |
| [12] | 陈军, 汪永丰, 郑佳佳, 等. 中国阿牙克库木湖水量变化及其驱动机制[J]. 自然资源学报, 2019, 34(6):1345-1356. |
| [ Chen Jun, Wang Yongfeng, Zheng Jiajia, et al. The changes in the water volume of Ayakekumu Lake based on satellite remote sensing data[J]. Journal of Natural Resources, 2019, 34(6):1345-1356. ] | |
| [13] | 王鹏飞, 郭云艳, 周康, 等. 1961—2018年呼伦湖水面面积变化特征及其对气候变化的响应[J]. 环境科学研究, 2021, 34(4):792-800. |
| [ Wang Pengfei, Guo Yunyan, Zhou Kang, et al. Variation of lake area of Hulun Lake during 1961-2018 and its response to climate change[J]. Research of Environmental Sciences, 2021, 34(4):792-800. ] | |
| [14] | 德吉央宗, 拉巴卓玛, 拉巴, 等. 1975—2013年西藏佩枯错湖面变化及分析[J]. 湖泊科学, 2016, 28(6):1338-1347. |
| [ Dekey Yangzong, Laba Zhuoma, La Ba, et al. Lake area variation of Peiku Tso(lake) in 1975-2013 and its influential factors[J]. Journal of Lake Sciences, 2016, 28(6):1338-1347. ] | |
| [15] | 拉巴卓玛, 德吉央宗, 拉巴, 等. 近40 a西藏那曲当惹雍错湖泊面积变化遥感分析[J]. 湖泊科学, 2017, 29(2):480-489. |
| [ Laba Zhuoma, Deji Yangzong, La Ba, et al. Remote sensing analysis on the area variations of Tangra Yutso in Tibetan Plateau over the past 40 years[J]. Journal of Lake Sciences, 2017, 29(2):480-489. ] | |
| [16] | 李均力, 胡汝骥, 黄勇, 等. 1964—2014年柴窝堡湖面积的时序变化及驱动因素[J]. 干旱区研究, 2015, 32(3):417-427. |
| [ Li Junli, Hu Ruji, Huang Yong, et al. Spatial-temporal characterstics of Chaiwopu Lake area change and its driving factors from 1964 to 2014[J]. Arid Zone Research, 2015, 32(3):417-427. ] | |
| [17] | 李均力, 白洁, 王亚俊. 1964—2015年阿牙克库木湖时序变化的气候响应[J]. 干旱区研究, 2018, 35(1):85-95. |
| [ Li Junli, Bai Jie, Wang Yajun. Time series area of the Ayakkum Lake and its response to climate change[J]. Arid Zone Research, 2018, 35(1):85-95. ] | |
| [18] | 王宇, 李均力, 郭木加甫, 等. 1989-2014年赛里木湖水面面积的时序变化特征[J]. 干旱区地理, 2016, 39(4):851-860. |
| [ Wang Yu, Li Junli, Guomu Jiapu, et al. Time-series analysis of Sayram Lake area changes during 1989-2014[J]. Arid Land Geography, 2016, 39(4):851-860. ] | |
| [19] | 彭焕华, 张静, 梁继, 等. 东洞庭湖水面面积变化监测及其与水位的关系[J]. 长江流域资源与环境, 2020, 29(12):2770-2780. |
| [ Peng Huanhua, Zhang Jing, Liang Ji, et al. Monitoring the changes of water area and its relation with water levels of hydrological station in East Dongting Lake[J]. Resources and Environment in the Yangtze Basin, 2020, 29(12):2770-2780. ] | |
| [20] | 曹国亮, 李天辰, 陆垂裕, 等. 干旱区季节性湖泊面积动态变化及蒸发量——以艾丁湖为例[J]. 干旱区研究, 2020, 37(5):1095-1104. |
| [ Cao Guoliang, Li Tianchen, Lu Chuiyu, et al. Dynamic variation and evaporation of seasonal lakes in arid areas: A case study for the Aiding Lake[J]. Arid Zone Research, 2020, 37(5):1095-1104. ] | |
| [21] | 钟巍, 张进, 尹焕玲, 等. 新疆巴里坤湖全新世湖泊沉积物稳定氮同位素的气候与环境意义研究[J]. 华南师范大学学报(自然科学版), 2013, 45(6):182-188. |
| [ Zhong Wei, Zhang Jin, Yin Huanling, et al. Study on the climatic and environmental implication of stable nitrogen isotopes from the holocene lacustrine sediments in Balikun Lake in Xinjiang[J]. Journal of South China Normal University(Natural Science Edition), 2013, 45(6):182-188. ] | |
| [22] |
An C B, Lu Y B, Zhao J J, et al. A high-resolution record of Holocene environmental and climatic changes from Lake Balikun (Xinjiang, China): Implications for central Asia[J]. The Holocene, 2011, 22(1):43-52.
doi: 10.1177/0959683611405244 |
| [23] | 陈永强, 钟巍, 谭玲玲, 等. 西风区湖泊沉积物中砷元素对气候环境变化的响应研究——以新疆巴里坤湖为例[J]. 华南师范大学学报(自然科学版), 2015, 47(6):83-90. |
| [ Chen Yongqiang, Zhong Wei, Tan Lingling, et al. Climate evolution response to arsenic component from lacustrine sediments in westerly region: A case study of Barkol Lake, Xinjiang[J]. Journal of South China Normal University(Natural Science Edition), 2015, 47(6):83-90. ] | |
| [24] | 汪海燕, 岳乐平, 李建星, 等. 全新世以来巴里坤湖面积变化及气候环境记录[J]. 沉积学报, 2014, 32(1):93-100. |
| [ Wang Haiyan, Yue Leping, Li Jianxing, et al. Changing of the lake area and records of climate and environment of Barkol Lake during Holocene[J]. Acta Sedimentologica Sinica, 2014, 32(1):93-100. ] | |
| [25] | 曹相东, 李秀花, 武胜利. 近30年巴里坤湖水域面积动态变化与气象因素分析[J]. 湖北农业科学, 2015, 54(4):848-851. |
| [ Cao Xiangdong, Li Xiuhua, Wu Shengli. The dynamic changes of Barkol Lake area and meteorological factors of recent 30 years[J]. Hubei Agricultural Sciences, 2015, 54(4):848-851. ] | |
| [26] | 邢文渊, 肖继东, 沙依然, 等. 基于MODIS影像的湖泊动态变化遥感监测——以巴里坤湖为例[J]. 草业科学, 2009, 26(7):28-31. |
| [ Xing Wenyuan, Xiao Jidong, Sha Yiran, et al. Remote sensed monitoring of lake dynamic change based on MODIS image: A case study of the Barkol Kazakhstan autonomous county[J]. Pratacultural Science, 2009, 26(7):28-31. ] | |
| [27] | 王世江. 中国新疆河湖全书[M]. 北京: 中国水利水电出版社, 2011. |
| [ Wang Shijiang. Encyclopaedia of Xinjiang Rivers and Lakes[M]. Beijing: China Water & Power Press, 2011. ] | |
| [28] | 郑松林, 罗丽萍. 巴里坤湖水质18年变化及水资源保护方案研究[J]. 环境科学与技术, 2011, 34(8):85-88, 119. |
| [ Zheng Songlin, Luo Liping. Variation of water quality in Balikun Lake in the last 18 years and water resource protection strategies[J]. Environmental Science & Technology, 2011, 34(8):85-88, 119. ] | |
| [29] | Scaramuzza P, Micijevic E, Chander G. SLC gap-filled products: Phase one methodology[EB/OL]. http://landsat.usgs.gov/documents/SLC_Gap_Fill_Methodology.pdf, 2008-07-18. |
| [30] |
McFeeters S K. The use of the normalized difference water index (NDWI) in the delineation of open water features[J]. International Journal of Remote Sensing, 2007, 17(7):1425-1432.
doi: 10.1080/01431169608948714 |
| [31] |
Zhang Y F, Liang W T, Liao Z L, et al. Effects of climate change on lake area and vegetation cover over the past 55 years in Northeast Inner Mongolia grassland, China[J]. Theoretical and Applied Climatology, 2019, 138(1/2):13-25.
doi: 10.1007/s00704-019-02802-2 |
| [32] | 张娜, 乌力吉, 刘松涛, 等. 呼伦湖地区气候变化特征及其对湖泊面积的影响[J]. 干旱区资源与环境, 2015, 29(7):192-197. |
| [ Zhang Na, Wu Liji, Liu Songtao, et al. The characteristics of climate change and its influence on water area of Hulun lake[J]. Journal of Arid Land Resources and Environment, 2015, 29(7):192-197. ] | |
| [33] |
Mann H B. Nonparametric tests against trend[J]. Econometrica, 1945, 13(3):245-259.
doi: 10.2307/1907187 |
| [34] | 李玉焦, 陈亚宁, 张齐飞, 等. 1960—2018年博斯腾湖水位变化特征及其影响因素分析[J]. 干旱区研究, 2021, 38(1):48-58. |
| [ Li Yujiao, Chen Yaning, Zhang Qifei, et al. Analysis of the change in water level and its influencing factors on Bosten Lake from 1960 to 2018[J]. Arid Zone Research, 2021, 38(1):48-58. ] | |
| [35] | 卓世新, 冯桂红, 石侃. 近55 a巴里坤降水量与蒸发量变化[J]. 气候变化研究快报, 2016, 5(2):78-85. |
| [ Zhuo Shixin, Feng Guihong, Shi Kan. Precipitation and evaporation change in the Balikun over last 55 years[J]. Climate Change Research Letters, 2016, 5(2):78-85. ] | |
| [36] | 高伟, 李小锋, 郭正刚. 基于3S技术的荒漠绿洲土地利用/土地覆被变化特征——以新疆巴里坤县为例[J]. 草业科学, 2012, 29(10):1533-1538. |
| [ Gao Wei, Li Xiaofeng, Guo Zhenggang. Features of land use/land cover change in the oasis-desert region based on 3S technologies: A case study of the Barkol Kazakhstan autonomous county[J]. Pratacultural Science, 2012, 29(10):1533-1538. ] | |
| [37] | 李东昇, 张仁勇, 崔步礼, 等. 1986—2015年青藏高原哈拉湖湖泊动态对气候变化的响应[J]. 自然资源学报, 2021, 36(2):501-512. |
| [ Li Dongsheng, Zhang Renyong, Cui Buli, et al. Response of lake dynamics to climate change in the Hala Lake Basin of Tibetan Plateau from 1986 to 2015[J]. Journal of Natural Resources, 2021, 36(2):501-512. ] | |
| [38] | 除多, 普穷, 拉巴卓玛, 等. 近40 a西藏羊卓雍错湖泊面积变化遥感分析[J]. 湖泊科学, 2012, 24(3):494-502. |
| [ Chu Duo, Pu Qiong, Laba Zhuoma, et al. Remote sensing analysis on lake area variations of Yamzho Yumco in Tibetan Plateau over the past 40 a[J]. Journal of Lake Sciences, 2012, 24(3):494-502. ] | |
| [39] | 李续续, 居马·吐尔逊, 伊永强. 新疆巴里坤县地下水开发利用及环境地质问题[J]. 西部探矿工程, 2014, 26(12):119-122. |
| [ Li Xuxu, Juma Tuerxun, Yi Yongqiang. Groundwater development and utilization and environmental geological problems in Barkol County, Xinjiang[J]. West-China Exploration Engineering, 2014, 26(12):119-122. ] | |
| [40] | 李筱艺. 哈密地区农牧业水资源利用中的问题及对策分析[D]. 成都: 四川农业大学, 2017. |
| [ Li Xiaoyi. Analysis on the Problems and Countermeasures of Water Resources Utilization of Agriculture and Animal Husbandry in Hami Area[D]. Chengdu: Sichuan Agricultural University, 2017. ] |
| [1] | 孙琳琳, 刘琼, 黄观, 陈勇航, 魏鑫, 郭玉琳, 张太西, 高天一, 许赟红. 新疆和周边“一带一路”地区不同云天条件下地表太阳辐射[J]. 干旱区研究, 2024, 41(9): 1480-1490. |
| [2] | 张群慧, 常亮, 顾小凡, 王倩, 马卯楠, 李小等, 段瑞, 犹香智. 1979—2020年柴达木盆地人体舒适度指数时空变化及趋势分析[J]. 干旱区研究, 2024, 41(8): 1300-1308. |
| [3] | 张宏伟, 别强, 石莹, 苏晓杰, 李欣璋. 黄河流域上游植被覆盖变化特征及其影响因素[J]. 干旱区研究, 2024, 41(8): 1385-1394. |
| [4] | 王怡雯, 马瑶瑶, 史培军, 张钢锋. 干旱区光伏电站运营对局地生态环境的影响[J]. 干旱区研究, 2024, 41(8): 1423-1433. |
| [5] | 菅政博, 罗浩, 单娜娜. “双碳”目标下新疆“三生”空间时空演变特征及碳效应[J]. 干旱区研究, 2024, 41(7): 1238-1248. |
| [6] | 柳华清, 王博, 贾妍妍, 解欣然, 张维. 新疆西天山峡谷不同坡位野核桃冻害特征[J]. 干旱区研究, 2024, 41(6): 1079-1088. |
| [7] | 马元植, 覃小林, 凌红波, 闫俊杰, 张广朋. 1991—2020年新疆中小湖泊面积变化时空特征及趋势分析[J]. 干旱区研究, 2024, 41(6): 905-916. |
| [8] | 张皓哲, 薛亚永, 马圆圆, 薛国玄. 新疆绿洲生态系统固碳潜力研究[J]. 干旱区研究, 2024, 41(6): 998-1009. |
| [9] | 白事麟, 吕雅雅, 师小军. 不同生境和基质对经过牛消化道的新疆野苹果种子萌发和幼苗生长的影响[J]. 干旱区研究, 2024, 41(5): 821-829. |
| [10] | 洪国军, 谢俊博, 张灵, 范振岐, 喻彩丽, 付仙兵, 李旭. 基于多光谱影像的阿拉尔垦区棉田土壤盐分反演[J]. 干旱区研究, 2024, 41(5): 894-904. |
| [11] | 许超杰, 窦燕, 孟琪琳. 基于EMD-GWO-LSTM模型的新疆标准化降水蒸散指数预测方法研究[J]. 干旱区研究, 2024, 41(4): 527-539. |
| [12] | 胡广录, 刘鹏, 李嘉楠, 陶虎, 周成乾. 黑河中游绿洲边缘三种景观类型土壤水分动态特征及影响因素[J]. 干旱区研究, 2024, 41(4): 550-565. |
| [13] | 张华, 押海廷, 徐存刚. 兰州市南北两山土壤水分遥感反演及植被需水量估算[J]. 干旱区研究, 2024, 41(4): 566-580. |
| [14] | 司琪, 樊浩然, 董文明, 刘新平. 新疆叶尔羌河流域景观生态风险评价及预测[J]. 干旱区研究, 2024, 41(4): 684-696. |
| [15] | 包佳玉, 李祥龙, 胡启文, 李涛. 新疆能源消费碳排放时空特征及能源结构调整路径探讨[J]. 干旱区研究, 2024, 41(3): 490-498. |
|
||