干旱区研究 ›› 2024, Vol. 41 ›› Issue (10): 1627-1638.doi: 10.13866/j.azr.2024.10.02
杨斐( ), 张文韬, 张飞民, 王澄海()
收稿日期:2024-02-06
修回日期:2024-06-18
出版日期:2024-10-15
发布日期:2024-10-14
通讯作者:
王澄海. E-mail: wch@lzu.edu.cn作者简介:杨斐(1992-),硕士,主要从事气候变化研究. E-mail: yangf21@lzu.edu.cn
基金资助:
YANG Fei(), ZHANG Wentao, ZHANG Feimin, WANG Chenghai()
Received:2024-02-06
Revised:2024-06-18
Published:2024-10-15
Online:2024-10-14
摘要:
随着全球变暖,中国西北地区出现了暖湿化现象。祁连山地处西北干旱区,东西跨越干旱、半干旱和极干旱气候区,气候也发生了明显变化,对区域生态及水文过程产生了显著的影响。本文基于1961—2022年祁连山以及周边地区常规气象站及雨量站观测的气温降水资料,分析了祁连山气温降水的时空变化特征以及降水与海拔的关系。结果表明:祁连山气温和降水在60 a来呈显著增加趋势,气温年际变化在祁连山中段最大,降水年际变化在祁连山东段最大,在西段最小,山区降水年际变率最大出现在8月。祁连山地区气温增加倾向率约0.36 ℃·(10a)-1,高于全国水平0.21 ℃·(10a)-1,冬季升温速率最大为0.45 ℃·(10a)-1,西段区域升温速率最大为0.5 ℃·(10a)-1;中段区域降水增加速率最大为11.86 mm·(10a)-1。祁连山以及周边地区降水增加速率随海拔高度增加。山区降水存在两个峰值,夏季降水量极大值出现在海拔2600~2800 m的高度带,海拔3600~3800 m出现第二个峰值。不同山系降水量随海拔变化大多呈单峰型分布;其中达坂山迎风坡降水量最大,青海南山降水量最小。祁连山地区的气候总体上呈现出暖湿化倾向。年平均最低温度的增加快于最高温度的增加趋势,最低温度在祁连山西段增加最为明显,最低气温的快速上升会对祁连山冰川、生态系统产生影响。
杨斐, 张文韬, 张飞民, 王澄海. 1961—2022年祁连山气候特征及其变化[J]. 干旱区研究, 2024, 41(10): 1627-1638.
YANG Fei, ZHANG Wentao, ZHANG Feimin, WANG Chenghai. Climate characteristics and variation in the Qilian Mountains from 1961 to 2022[J]. Arid Zone Research, 2024, 41(10): 1627-1638.
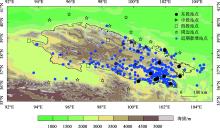
图1
祁连山地形和站点分布"
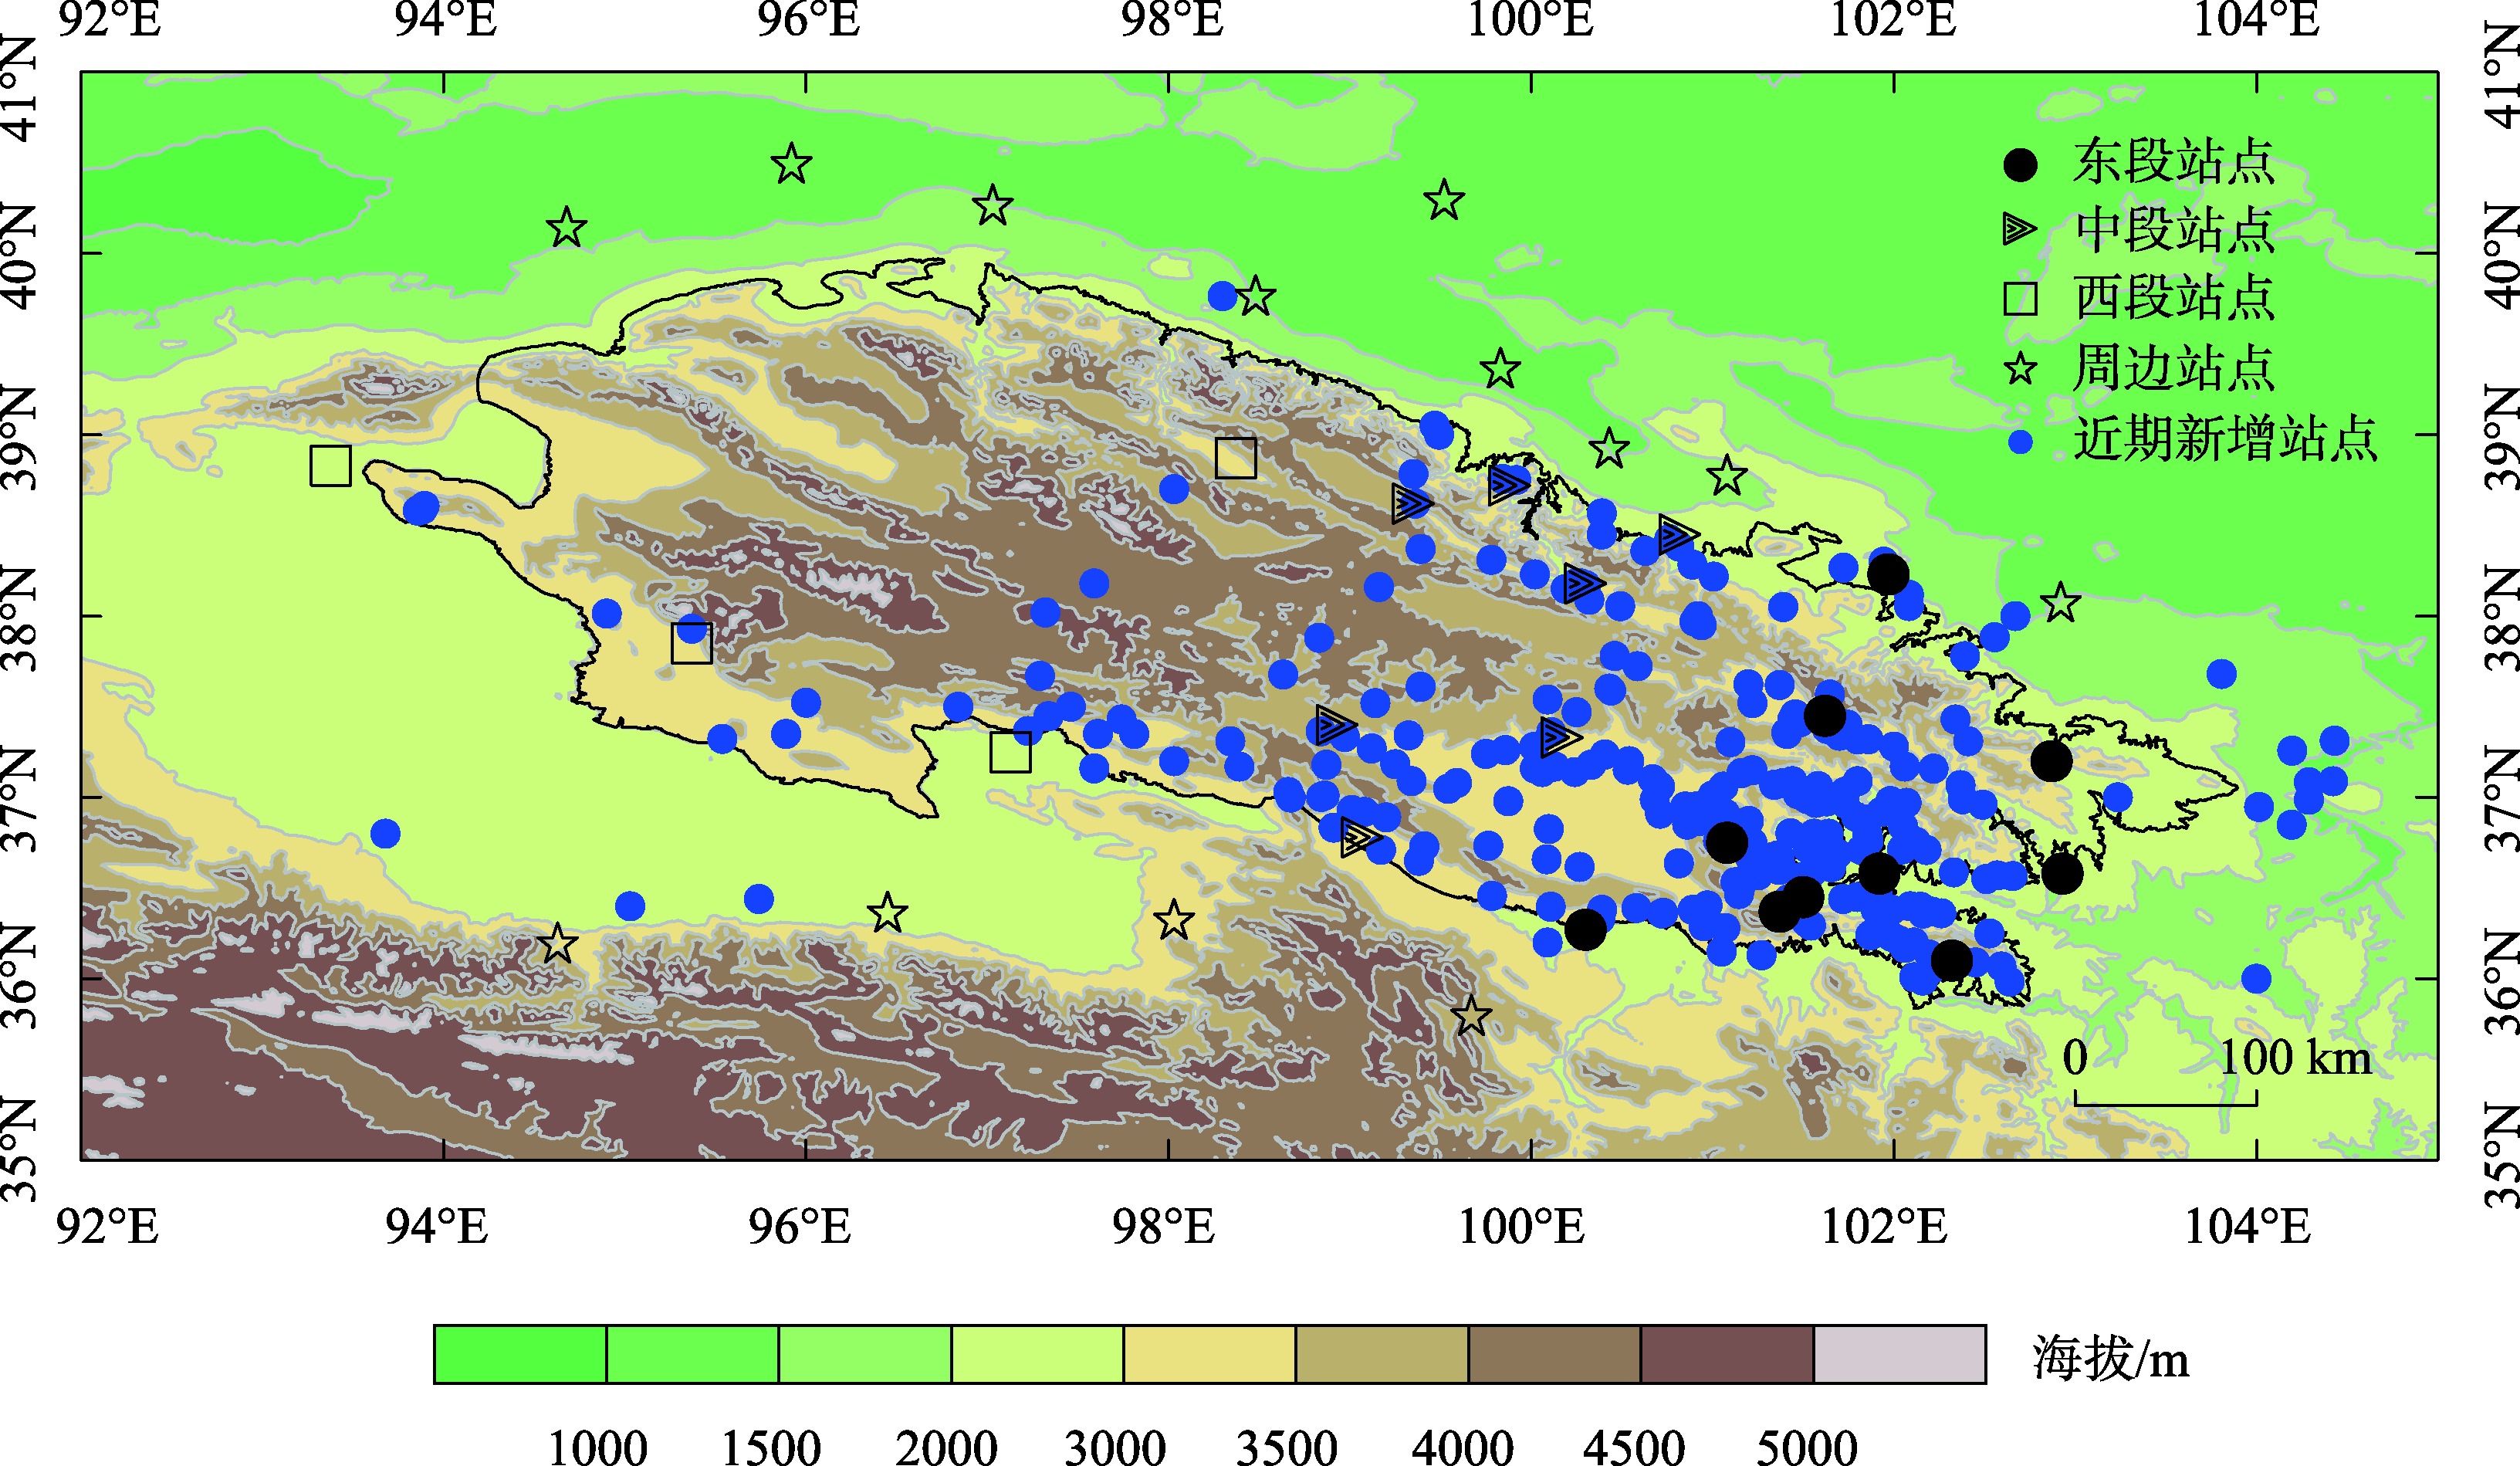
表1
祁连山东段、中段、西段有近60 a降水气温观测的站点"
| 分区 | 站点 |
|---|---|
| 东段 | 乌鞘岭,民和,化隆,永昌,门源,西宁,湟源, 湟中,贵德,共和 |
| 中段 | 民乐,肃南,野牛沟,祁连,刚察,茶卡,天峻 |
| 西段 | 冷湖,大柴旦,托勒,德令哈 |
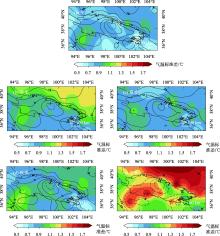
图2
1961—2022年祁连山平均气温(等值线,单位:℃)和气温标准差(填色,单位:℃)"

图3
1961—2022 年祁连山降水量(等值线,单位:mm)和降水标准差(填色,单位:mm)"

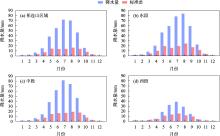
图4
1961—2022年祁连山不同区域逐月降水量及其标准差"
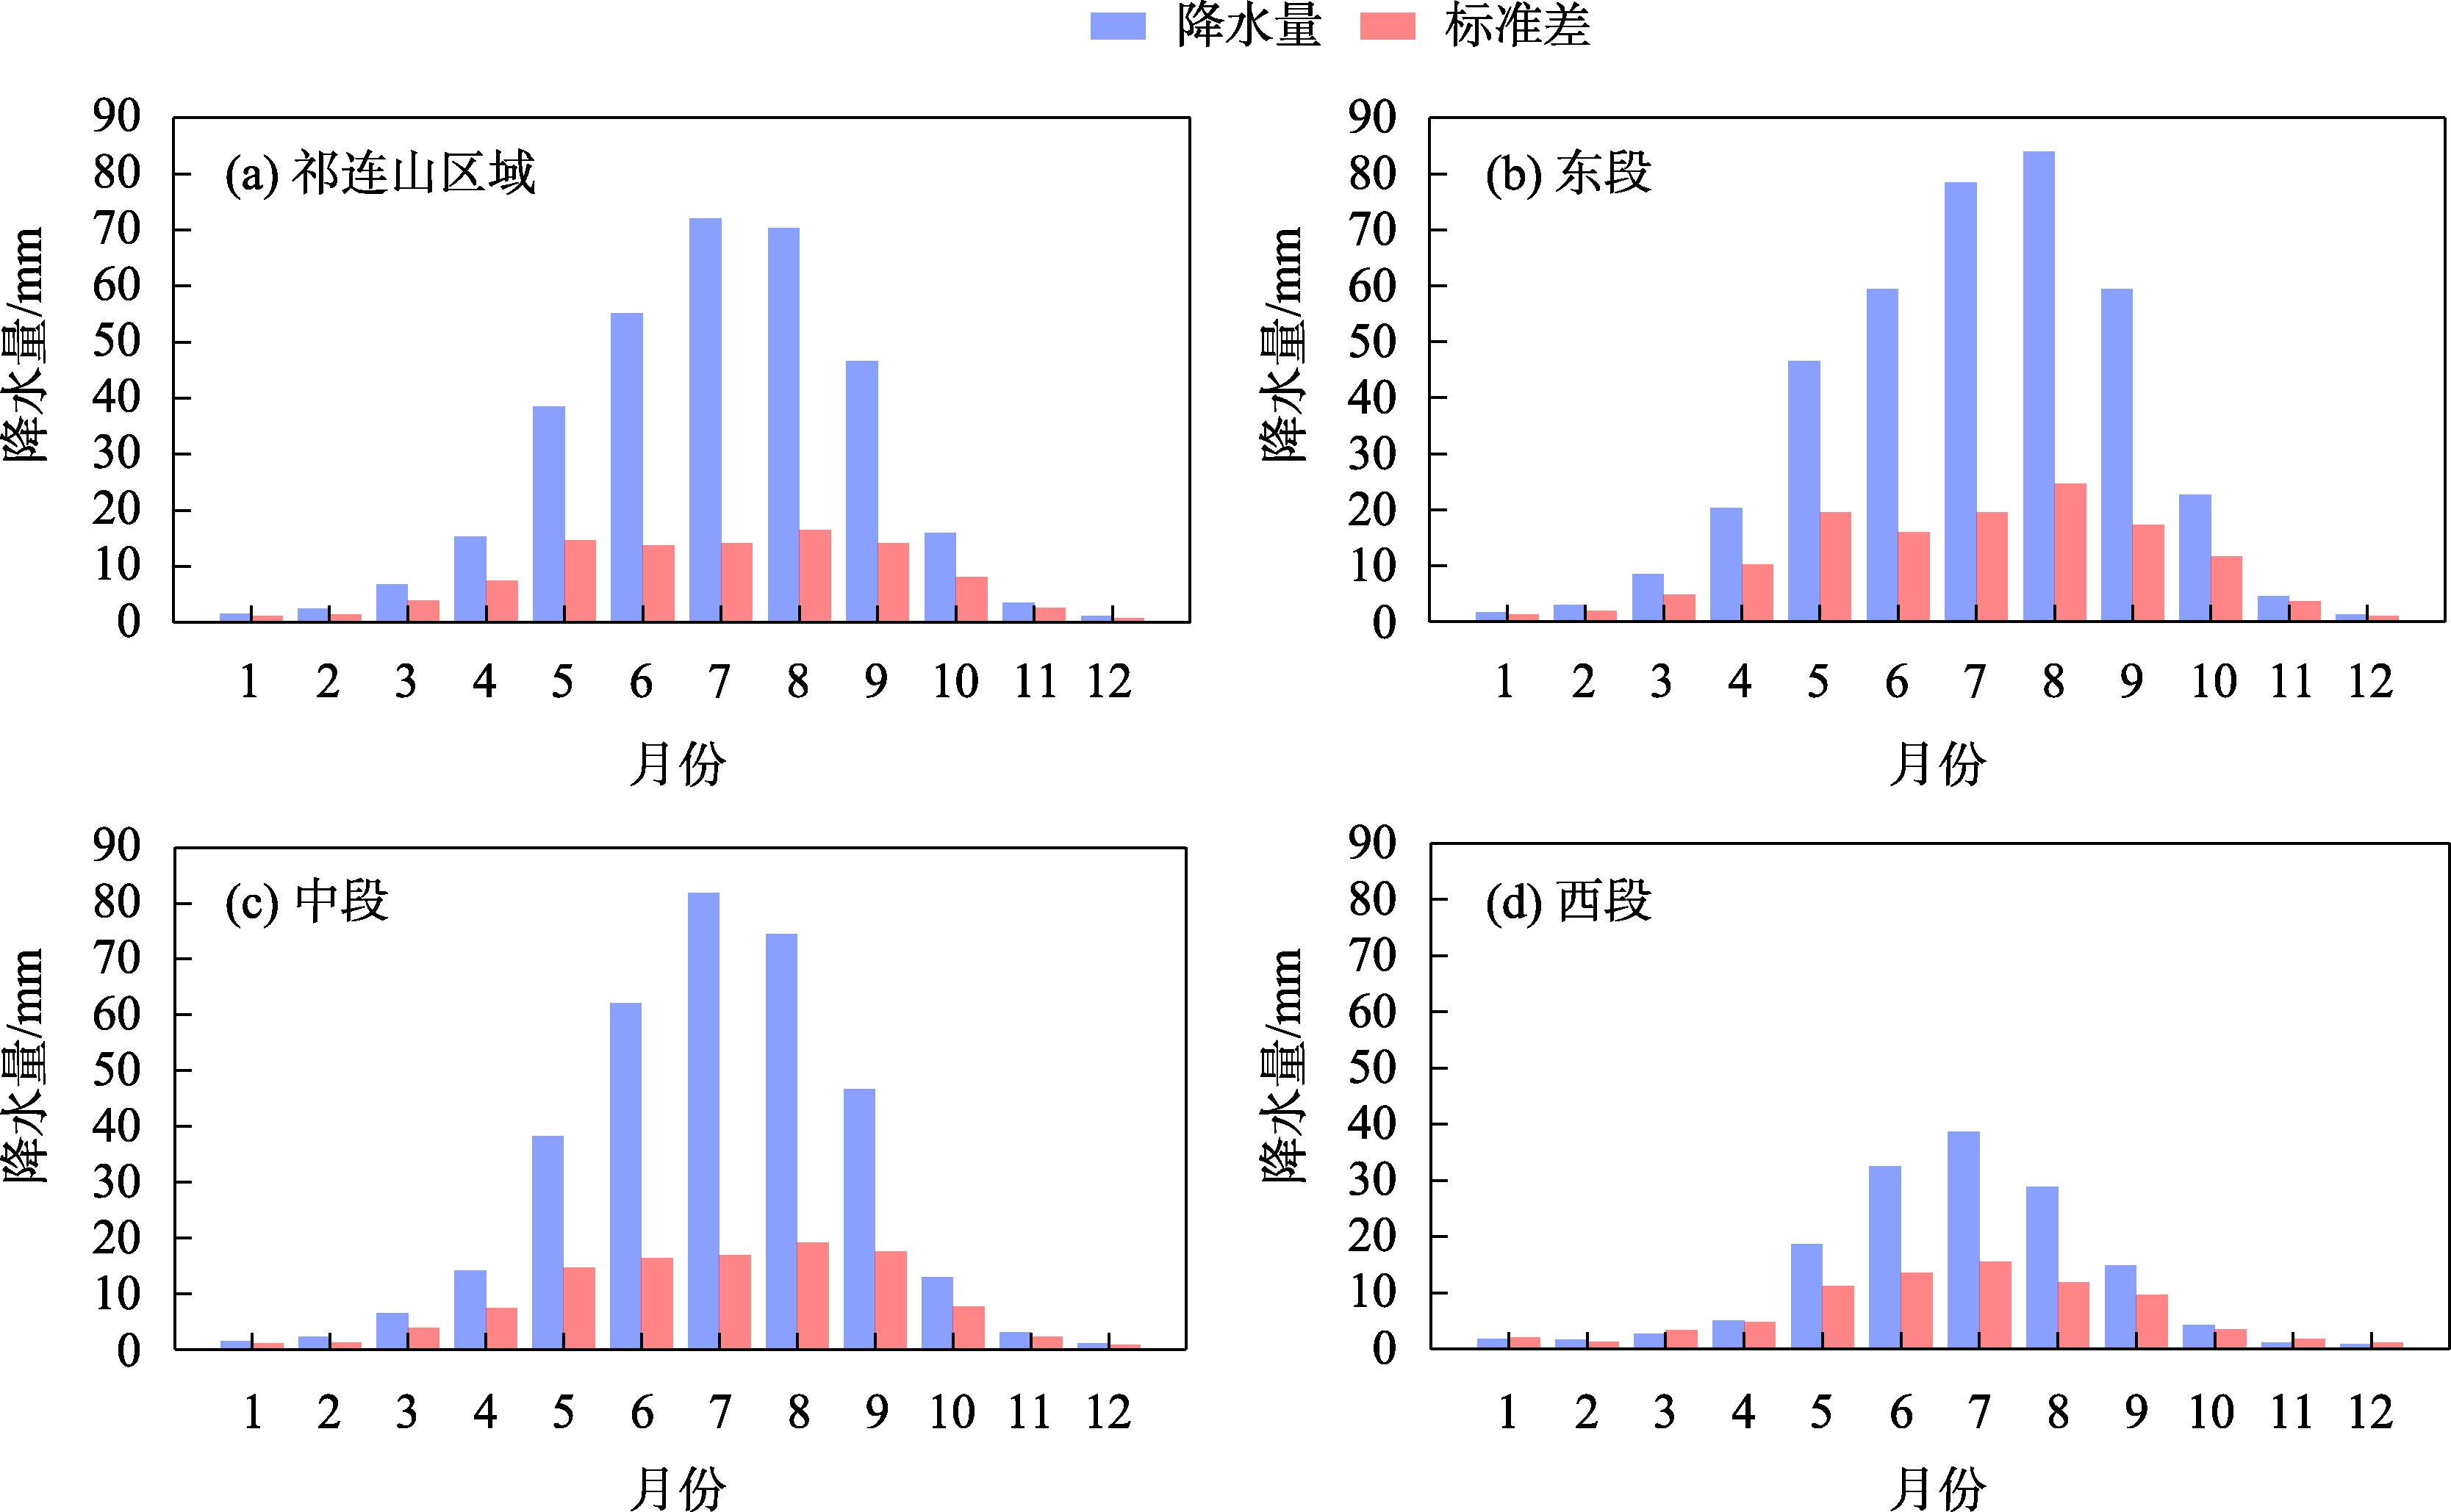
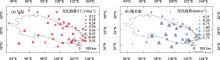
图5
1961—2022年祁连山及周边地区气温、降水量的变化趋势 注:蓝/黄色箭头表示降水趋势增加/减少,红色加号表示降水趋势通过95%信度水平的显著性检验,所有站点的气温变化趋势均通过95%信度水平的显著性检验。"

表2
祁连山气温和降水增加倾向率"
| 季节 | 祁连山地区 | 祁连山东段 | 祁连山中段 | 祁连山西段 | |||||||
|---|---|---|---|---|---|---|---|---|---|---|---|
| 气温增加 倾向率 /[℃·(10a)-1] | 降水增加 倾向率 /[mm·(10a)-1] | 气温增加 倾向率 /[℃·(10a)-1] | 降水增加 倾向率 /[mm·(10a)-1] | 气温增加 倾向率 /[℃·(10a)-1] | 降水增加 倾向率 /[mm·(10a)-1] | 气温增加 倾向率 /[℃·(10a)-1] | 降水增加 倾向率 /[mm·(10a)-1] | ||||
| 全年 | 0.36 | 9.94 | 0.35 | 8.39 | 0.37 | 11.86 | 0.39 | 10.48 | |||
| 春季 | 0.3 | 2.01 | 0.3 | 1.91 | 0.31 | 2.38 | 0.29 | 1.6 | |||
| 夏季 | 0.32 | 5.76 | 0.32 | 4.04 | 0.32 | 7.38 | 0.33 | 7.21 | |||
| 秋季 | 0.35 | 1.87 | 0.32 | 2.04 | 0.37 | 1.88 | 0.39 | 1.42 | |||
| 冬季 | 0.45 | 0.3 | 0.44 | 0.39 | 0.44 | 0.22 | 0.5 | 0.25 | |||
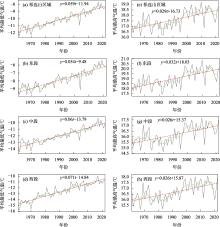
图6
1961—2022年祁连山不同区域最高最低气温变化"

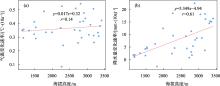
图7
祁连山及周边地区海拔高度与气温(a)、降水(b)变化速率的相关性"
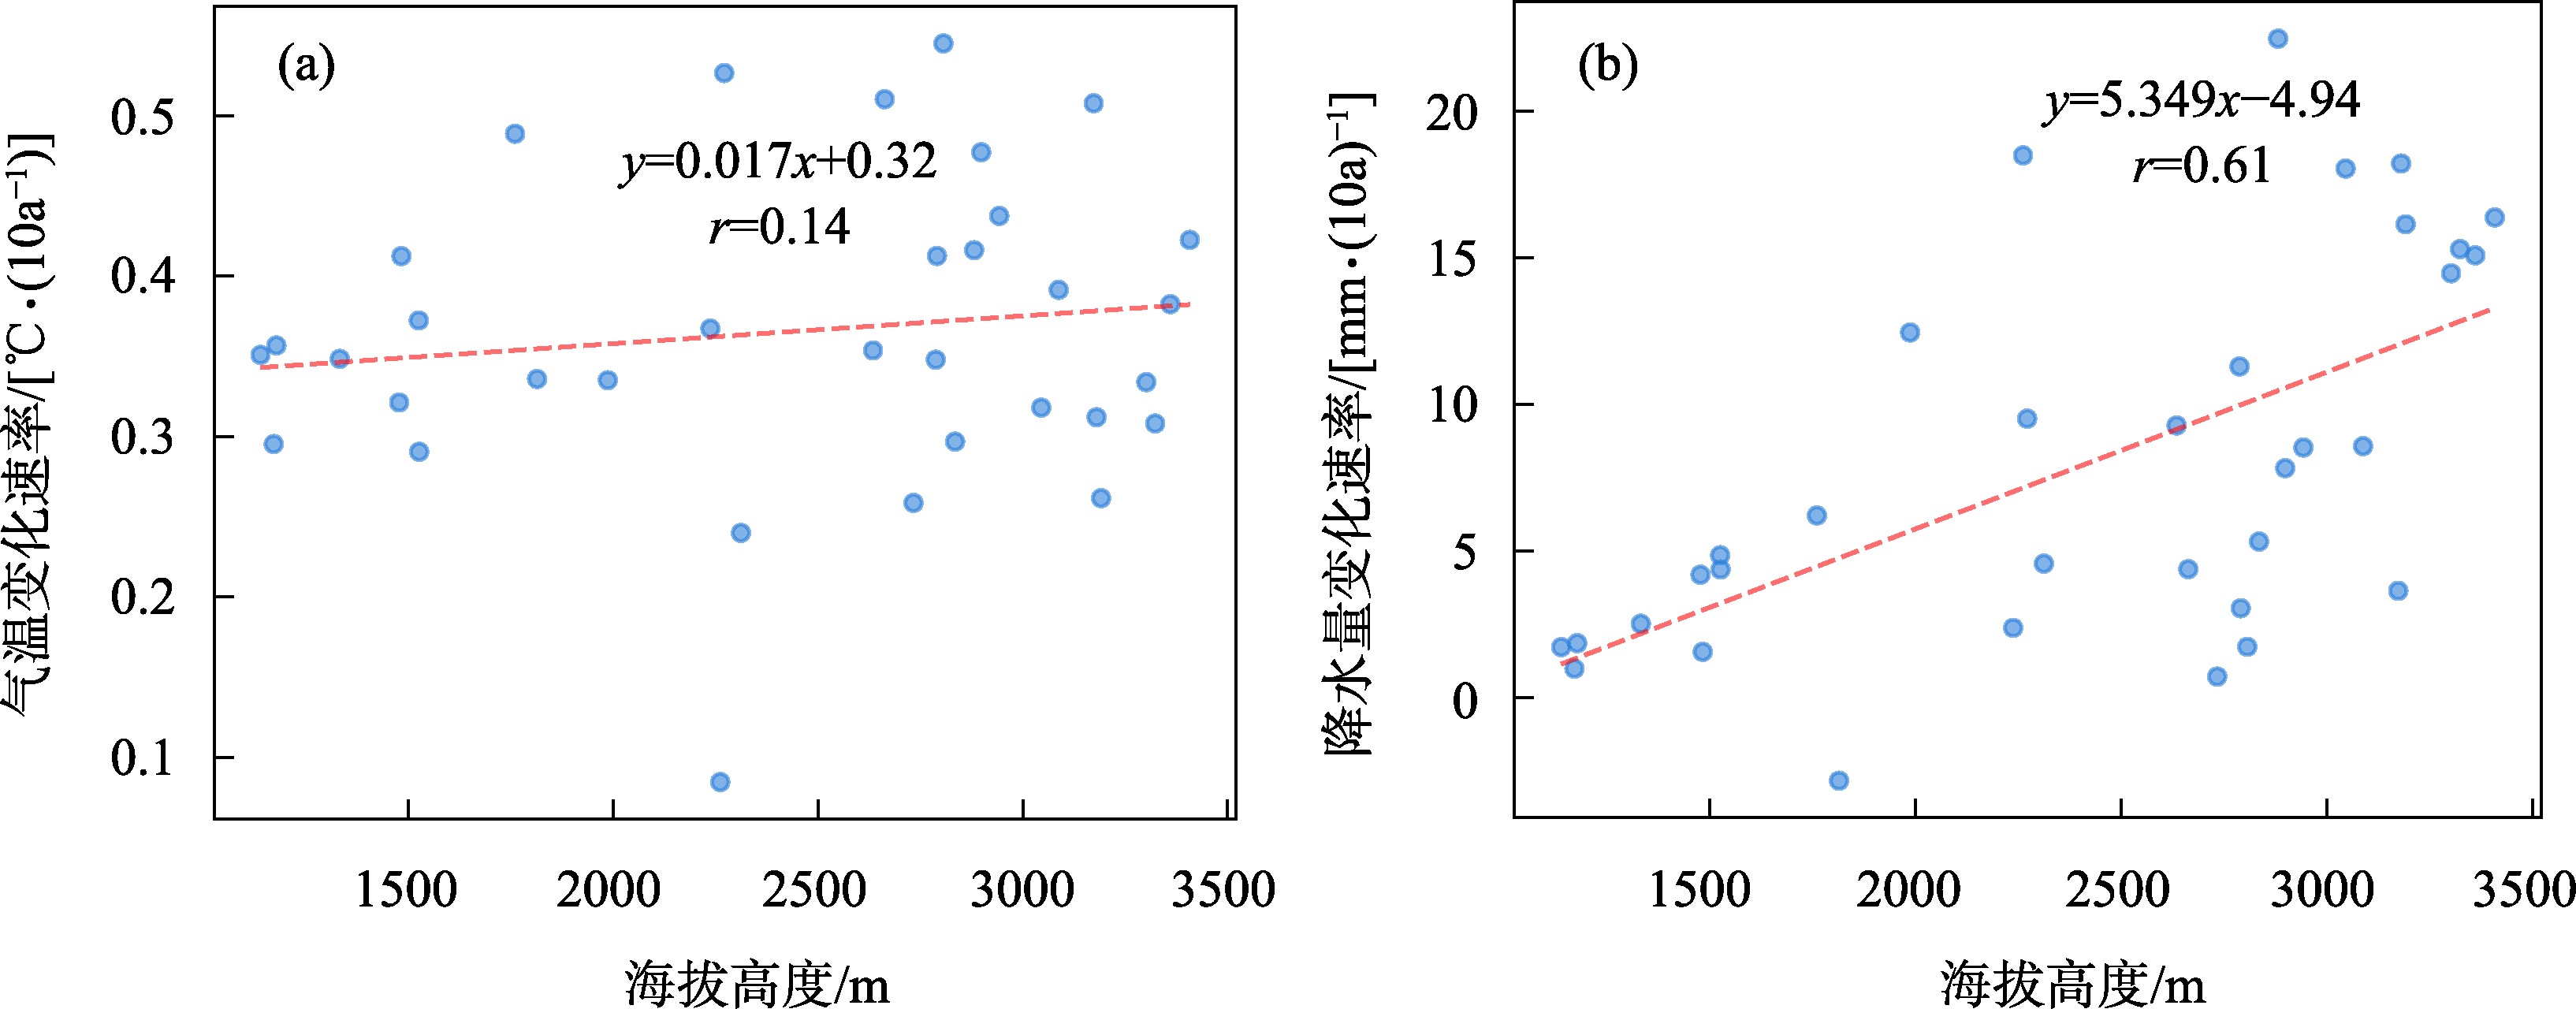
图8
祁连山区降水量随海拔高度的变化"
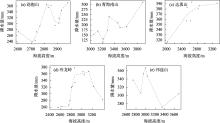
图9
祁连山区不同山系降水量和海拔高度的关系"

| [1] | IPCC, 2023: Sections[C]//Climate Change 2023: Synthesis Report. Contribution of Working Groups I, II and III to the Sixth Assessment Report of the Intergovernmental Panel on Climate Change [Core Writing Team, H. Lee and J. Romero (eds.)]. IPCC, Geneva, Switzerland, 2023: 35-115. |
| [2] | Yang J, Yang K, Zhang F, et al. Contributions of natural and anthropogenic factors to historical changes in vegetation cover and its future projections in the Yellow River Basin, China[J]. International Journal of Climatology, 2023, 43(14): 6434-6449. |
| [3] |
王澄海, 张晟宁, 张飞民, 等. 论全球变暖背景下中国西北地区降水增加问题[J]. 地球科学进展, 2021, 36(9): 980-989.
doi: 10.11867/j.issn.1001-8166.2021.087 |
|
[Wang Chenghai, Zhang Shengning, Zhang Feimin, et al. On the increase of precipitation in the Northwestern China under the global warming[J]. Advances in Earth Science, 2021, 36(9): 980-989.]
doi: 10.11867/j.issn.1001-8166.2021.087 |
|
| [4] |
王澄海, 杨金涛, 杨凯, 等. 过去近60 a黄河流域降水时空变化特征及未来30 a变化趋势[J]. 干旱区研究, 2022, 39(3): 708-722.
doi: 10.13866/j.azr.2022.03.05 |
|
[Wang Chenghai, Yang Jintao, Yang Kai, et al. Changing precipitation characteristics in the Yellow River Basin in the last 60 years and tendency prediction for next 30 years[J]. Arid Zone Research, 2022, 39(3): 708-722.]
doi: 10.13866/j.azr.2022.03.05 |
|
| [5] | Wang C. Climatology in Cold Regions[M]. Hoboken: John Wiley & Sons, 2023. |
| [6] | 王玉洁. 中国西北干旱区气候变化及典型流域影响适应研究[D]. 南京: 南京大学, 2017. |
| [Wang Yujie. Research of Climate Change and in Arid Area of Northwest China and Its Impacts and Adaption on Typical Basins[D]. Nanjing: Nanjing University, 2017.] | |
| [7] | Zhang Q, Yang J, Wang W, et al. Climatic warming and humidification in the arid region of Northwest China: Multi-scale characteristics and impacts on ecological vegetation[J]. Journal of Meteorological Research, 2021, 35(1): 113-127. |
| [8] | 张强, 朱飙, 杨金虎, 等. 西北地区气候湿化趋势的新特征[J]. 科学通报, 2021, 66(Z2): 3757-3771. |
| [Zhang Qiang, Zhu Biao, Yang Jinhu, et al. New characteristics about the climatic humidification trend in Northwest China[J]. China Science Bulletin, 2021, 66 (Z2): 3757-3771.] | |
| [9] |
张红丽, 韩富强, 张良, 等. 西北地区气候暖湿化空间与季节差异分析[J]. 干旱区研究, 2023, 40(4): 517-531.
doi: 10.13866/j.azr.2023.04.01 |
|
[Zhang Hongli, Han Fuqiang, Zhang Liang, et al. Analysis of spatial and seasonal variations in climate warming and humidification in Northwest China[J]. Arid Zone Research, 2023, 40(4): 517-531.]
doi: 10.13866/j.azr.2023.04.01 |
|
| [10] |
徐栋, 孔莹, 王澄海. 西北干旱区水汽收支变化及其与降水的关系[J]. 干旱气象, 2016, 34(3): 431-439.
doi: P467 |
| [Xu Dong, Kong Ying, Wang Chenghai. Changes of water vapor budget in arid area of Northwest China and its relationship with precipitation[J]. Journal of Arid Meteorology, 2016, 34(3): 431-439.] | |
| [11] | 王澄海, 李健, 许晓光. 中国近50年气温变化准3年周期的普遍性及气温未来的可能变化趋势[J]. 高原气象, 2012, 31(1): 126-136. |
| [Wang Chenghai, Li Jian, Xu Xiaoguang. Universality of quasi-3-year period of temperature in last 50 years and change in next 20 years in China[J]. Plateau Meteorology, 2012, 31(1): 126-136.] | |
| [12] | 冯起, 李宗省, 王旭峰, 等. 祁连山生态变化评估报告[R]. 兰州: 中国科学院西北生态环境资源研究院, 2018: 74-76. |
| [Feng Qi, Li Zongxing, Wang Xufeng, et al. Ecological Change Assessment Report of Qilian Mountains[R]. Lanzhou: Northwest Institute of Eco-Environment and Resources, CAS, 2018: 74-76.] | |
| [13] | Wang L, Chen R, Han C, et al. Change characteristics of precipitation and temperature in the Qilian Mountains and Hexi Oasis, Northwestern China[J]. Environmental Earth Sciences, 2019, 78: 1-13. |
| [14] |
敬文茂, 任小凤, 赵维俊. 1965—2018年祁连山北麓及其附近地区气温与降水变化的时空格局[J]. 高原气象, 2022, 41(4): 876-886.
doi: 10.7522/j.issn.1000-0534.2021.00075 |
|
[Jing Wenmao, Ren Xiaofeng, Zhao Weijun. Spatio-temporal pattern variations of temperature and precipitation in Northern parts of the Qilian Mountains and the nearby regions from 1965 to 2018[J]. Plateau Meteorology, 2022, 41(4): 876-886.]
doi: 10.7522/j.issn.1000-0534.2021.00075 |
|
| [15] |
王士维, 孙栋元, 周敏, 等. 1951—2020年疏勒河流域气温时空变化特征[J]. 干旱区研究, 2023, 40(7): 1065-1074.
doi: 10.13866/j.azr.2023.07.04 |
|
[Wang Shiwei, Sun Dongyuan, Zhou Min, et al. Temporal and spatial variation of temperature in the Shule River Basin from 1951 to 2020[J]. Arid Zone Research, 2023, 40(7): 1065-1074.]
doi: 10.13866/j.azr.2023.07.04 |
|
| [16] | 蓝永超, 康尔泗, 张济世, 等. 祁连山区近50 a来的气温序列及变化趋势[J]. 中国沙漠, 2001, 21(1): 53-57. |
| [Lan Yongchao, Kang Ersi, Zhang Jishi, et al. Air temperature series and its changing trends in Qilian mountains area since 1950s[J]. Journal of Desert Research, 2001, 21(1): 53-57.] | |
| [17] | 黄波. 祁连山地区降水的时空分布特征及数值模拟研究[D]. 兰州: 兰州大学, 2012. |
| [Huang Bo. Study on the Spatial and Temporal Distribution Characteristic of Precipitation and Numerical Simulation in Qilianshan Mountains, N. W. China[D]. Lanzhou: Lanzhou University, 2012.] | |
| [18] | 王可丽, 江灏, 赵红岩. 西风带与季风对中国西北地区的水汽输送[J]. 水科学进展, 2005, 16(3): 432-438. |
| [Wang Keli, Jiang Hao, Zhao Hongyan. Atmospheric water vapor transport from westerly and monsoon over the Northwest China[J]. Advances in Water Science, 2005, 16(3): 432-438.] | |
| [19] | Tian H, Yang T, Liu Q. Climate change and glacier area shrinkage in the Qilian mountains, China, from 1956 to 2010[J]. Annals of Glaciology, 2014, 55(66): 187-197. |
| [20] | 贾文雄. 近50年来祁连山及河西走廊极端气温的季节变化特征[J]. 地理科学, 2012, 32(11): 1378-1383. |
| [Jia Wenxiong. Seasonal variation of extreme temperature in Qilian Mountains and Hexi Corridor in recent 50 years[J]. Scientia Geographica Sinica, 2012, 32(11): 1378-1383.] | |
| [21] | 罗汉, 张强, 杨兴国, 等. 祁连山云降水特征及云水资源开发利用技术研究进展与展望[J]. 冰川冻土, 2023, 45(2): 368-381. |
| [Luo Han, Zhang Qiang, Yang Xingguo, et al. Progress and prospect of cloud precipitation characteristics and cloud water resources exploitation and utilization technology in Qilian Mountains[J]. Journal of Glaciology and Geocryology, 2023, 45(2): 368-381.] | |
| [22] | 李岩瑛, 张强, 许霞, 等. 祁连山及周边地区降水与地形的关系[J]. 冰川冻土, 2010, 32 (1): 52-61. |
| [Li Yanying, Zhang Qiang, Xu Xia, et al. Relationship between precipitation and terrain over the Qilian Mountains and their ambient areas[J]. Journal of Glaciology and Geocryology, 2010, 32 (1): 52-61.] | |
| [23] | Chen R, Han C, Liu J, et al. Maximum precipitation altitude on the northern flank of the Qilian Mountains, northwest China[J]. Hydrology Research, 2018, 49(5): 1696-1710. |
| [24] | 常学向, 赵爱芬, 王金叶, 等. 祁连山林区大气降水特征与森林对降水的截留作用[J]. 高原气象, 2002, 21(3): 274-280. |
| [Chang Xuexiang, Zhao Aifen, Wang Jinye, et al. Precipitation characteristic and interception of forest in Qilian Mountain[J]. Plateau Meteorology, 2002, 21(3): 274-280.] | |
| [25] | 张杰, 李栋梁. 祁连山及黑河流域降雨量的分布特征分析[J]. 高原气象, 2004, 23(1): 81-88. |
| [Zhang Jie, Li Dongliang. Analysis on distribution character of rainfall over Qilian Mountain and Heihe Valley[J]. Plateau Meteorology, 2004, 23(1): 81-88.] | |
| [26] | 高翔, 黄星星, 刘宽梅, 等. 祁连山自然保护区植被对气候变化的响应[J]. 兰州大学学报(自然科学版), 2022, 58(1): 79-88. |
| [Gao Xiang, Huang Xingxing, Liu Kuanmei, et al. Vegetation responses to climate changes in Qilian Mountain Nature Reserve[J]. Journal of Lanzhou University (Natural Sciences), 2022, 58(1): 79-88.] | |
| [27] | 程瑛, 徐殿祥, 宋秀玲. 近50年祁连山西段夏季气候变化对冰川发育的影响[J]. 干旱区研究, 2009, 26(2): 294-298. |
| [Cheng Ying, Xu Dianxiang, Song Xiuling. Evaluation of the effects of summer climate change on glacier development in the west Qilian Mountains over the last 50 years[J]. Arid Zone Research, 2009, 26(2): 294-298.] | |
| [28] | 尤联元, 杨景春. 中国地貌[M]. 北京: 科学出版社, 2013. |
| [You Lianyuan, Yang Jingchun. Geomorphology of China[M]. Beijing: Science Press, 2013.] | |
| [29] | 尹宪志, 张强, 徐启运, 等. 近50年来祁连山区气候变化特征研究[J]. 高原气象, 2009, 28(1): 85-90. |
| [Yin Xianzhi, Zhang Qiang, Xu Qiyun, et al. Characteristics of climate change in Qilian Mountains region in recent 50 years[J]. Plateau Meteorology, 2009, 28(1): 85-90.] | |
| [30] | 贾文雄, 何元庆, 李宗省, 等. 祁连山区气候变化的区域差异特征及突变分析[J]. 地理学报, 2008, 63(3): 257-269. |
| [Jia Wenxiong, He Yuanqing, Li Zongxing, et al. The regional difference and catastrophe of climatic change in Qilian Mountains region[J]. Acta Geographica Sinica, 2008, 63(3): 257-269.] | |
| [31] | 王澄海, 张晟宁, 李课臣, 等. 1961—2018年西北地区降水的变化特征[J]. 大气科学, 2021, 45(4): 713-724. |
| [Wang Chenghai, Zhang Shengning, Li Kechen, et al. Change characteristics of precipitation in Northwest China from 1961 to 2018[J]. Chinese Journal of Atmospheric Sciences, 2021, 45(4): 713-724.] | |
| [32] | 蒋强, 魏林波, 李艳, 等. 基于高精度观测资料的2009—2019年祁连山地区降水特征分析[J]. 兰州大学学报(自然科学版), 2022, 58(1): 89-98. |
| [Jiang Qiang, Wei Linbo, Li Yan, et al. Analysis of precipitation characteristics in Qilian Mountains from 2009 to 2019 based on high precision observation data[J]. Journal of Lanzhou University (Natural Science Edition), 2022, 58(1): 89-98.] | |
| [33] | 任国玉, 郭军, 徐铭志, 等. 近50年中国地面气候变化基本特征[J]. 气象学报, 2005, 63(6): 942-956. |
| [Ren Guoyu, Guo Jun, Xu Mingzhi, et al. Climate changes of China over the past half century[J]. Acta Meteorologica Sinica, 2005, 63(6): 942-956.] | |
| [34] | 宋世凯. 全球变暖背景下1960—2014年中国降水时空变化特征[D]. 乌鲁木齐: 新疆大学, 2017. |
| [Song Shikai. Spatial and Temporal Variation Characterristics of Precipitation over China During 1960-2014 under global warming[D]. Urumqi: Xinjiang University, 2017.] |
| [1] | 李宇航, 余文学, 杨永均, 朱燕峰, 马静, 陈浮. 近60 a天山北坡经济带天然径流量时空变化及归因识别[J]. 干旱区研究, 2024, 41(9): 1446-1455. |
| [2] | 陆文静, 瞿德业, 杨明月, 黄翰林, 杨山泉. 基于GCM的蒙古高原降水稳定同位素模拟[J]. 干旱区研究, 2024, 41(9): 1491-1502. |
| [3] | 袁征, 张志高, 闫瑾, 刘嘉毅, 胡柱钰, 王赟, 蔡茂堂. 1960—2020年黄河流域不同等级降水时空特征[J]. 干旱区研究, 2024, 41(8): 1259-1271. |
| [4] | 李超, 隆霄, 曹怡清, 韩子霏, 王号, 郑景元. 不同风场结构下贺兰山地形降水的理想数值试验[J]. 干旱区研究, 2024, 41(8): 1272-1287. |
| [5] | 王岱, 李欣, 张雯, 马阳, 王素艳, 李佳瑶. 海温与海冰对宁夏汛期降水分布特征异常的协同影响[J]. 干旱区研究, 2024, 41(8): 1288-1299. |
| [6] | 吕壮壮, 乔庆庆, 董孙艺, 汪冬. 中中新世气候适宜期全球变暖背景下亚洲内陆干旱区古气候演化特征及驱动机制[J]. 干旱区研究, 2024, 41(8): 1309-1322. |
| [7] | 史天艺, 张萌萌, 蒲阳, 刘硕元. 毛乌素沙地植被NDVI动态及对降水的多时空响应[J]. 干旱区研究, 2024, 41(8): 1395-1404. |
| [8] | 李烨, 江伟, 陈晓俊, 吴英杰, 王思楠. 基于降水量距平百分率的1961—2020年鄂尔多斯气象干旱趋势[J]. 干旱区研究, 2024, 41(7): 1099-1111. |
| [9] | 周杰, 王旭虎, 杜维波, 周晓雷, 杨洁, 张晓玮. 气候变化背景下的天山云杉潜在分布区预测[J]. 干旱区研究, 2024, 41(7): 1167-1176. |
| [10] | 梁双河, 牛最荣, 贾玲. 祖厉河干流近65 a径流变化及归因分析[J]. 干旱区研究, 2024, 41(6): 928-939. |
| [11] | 李若楠, 李均力, 李爽爽, 刘帅琪, 都伟冰. 基于Sentinel-2的依连哈比尔尕冰川变化监测[J]. 干旱区研究, 2024, 41(6): 940-950. |
| [12] | 唐可欣, 郭建斌, 何亮, 陈林, 万龙. 中国旱区GPP时空演变特征及影响因素研究[J]. 干旱区研究, 2024, 41(6): 964-973. |
| [13] | 杨霞, 江远安, 张林梅, 李朋伦, 肖俊安. 哈密市伊吾县峡沟水库集水区汛期降水特征[J]. 干旱区研究, 2024, 41(5): 753-764. |
| [14] | 许超杰, 窦燕, 孟琪琳. 基于EMD-GWO-LSTM模型的新疆标准化降水蒸散指数预测方法研究[J]. 干旱区研究, 2024, 41(4): 527-539. |
| [15] | 尹瑞琪, 李琼芳, 陈启慧, 张静芳, 张炜, 林雍权, 方凯悦. 伊犁河上游流域三种日尺度降水产品性能评估[J]. 干旱区研究, 2024, 41(4): 540-549. |
|
||