干旱区研究 ›› 2021, Vol. 38 ›› Issue (6): 1793-1804.doi: 10.13866/j.azr.2021.06.31
• 生态与环境 • 上一篇
金梦婷( ),徐丽萍(),徐权
收稿日期:2021-06-03
修回日期:2021-07-24
出版日期:2021-11-15
发布日期:2021-11-29
通讯作者:
徐丽萍
作者简介:金梦婷(1996-),女,硕士研究生,主要从事土地利用覆被变化研究. E-mail: 基金资助:
JIN Mengting(),XU Liping(),XU Quan
Received:2021-06-03
Revised:2021-07-24
Online:2021-11-15
Published:2021-11-29
Contact:
Liping XU
摘要:
以新疆克孜勒苏柯尔克孜自治州(克州)为例,基于2005—2015年土地利用空间格局变化,利用FLUS-Markov复合模型预测2025年土地利用情况,采用Criteria Importance Though Intercrieria Correlation(CRITIC)权重法构建自然增长和生态保护情景下的景观生态风险指数,并采用自然断点法由低到高划分为5个等级(Risk Ⅰ、Risk Ⅱ、Risk Ⅲ、Risk Ⅳ和Risk Ⅴ),以风险指数质心和标准差椭圆评价不同年份、多情景下景观生态风险时空格局和变化特征,探究影响其演化特征的驱动因素。结果表明:(1) 在自然增长情景下,耕地、水域、建设用地面积不断增加,林地、草地、荒漠和裸地面积逐渐减小;生态保护情景下,草地相比于自然增长情景增加了51 km2。(2) 2005—2025年,克州景观生态风险整体呈现减小的趋势,生态保护情景相比于自然增长情景下的Risk Ⅰ、Risk Ⅱ和Risk Ⅳ面积分别增加34 km2、1240 km2和66 km2,Risk Ⅲ和Risk Ⅴ面积分别减少695 km2和645 km2。(3) 2005—2025年,自然增长情景下克州Risk Ⅰ、Risk Ⅱ、Risk Ⅳ和Risk Ⅴ呈扩散分布状态,Risk Ⅲ呈现紧凑收缩状态。(4) 影响景观生态风险演化的主要因素是地形气候因子(解释力85%以上),其次人口(解释力59%以上)也是重要的驱动因子,GDP对景观生态风险变化的贡献减小。
金梦婷,徐丽萍,徐权. 基于FLUS-Markov模型的多情景景观生态风险评价与预测——以南疆克州为例[J]. 干旱区研究, 2021, 38(6): 1793-1804.
JIN Mengting,XU Liping,XU Quan. FLUS-Markov model-based multiscenario evaluation and prediction of the landscape ecological risk in Kezhou, South Xinjiang[J]. Arid Zone Research, 2021, 38(6): 1793-1804.

图1
研究区位置及高程示意图"

表1
数据说明"
| 数据类型 | 数据内容 | 数据时间 | 数据分辨率 | 数据用途 |
|---|---|---|---|---|
| 土地利用数据 | 土地利用类型 | 2005年, 2015年 | 1 km×1 km | 模型输入数据 |
| 地形数据 | 高程、坡度 | 2005年, 2015年 | 30 m×30 m | 驱动因子数据 |
| 气候数据 | 气温、降水 | 2005年, 2015年 | 1 km×1 km | |
| 社会经济数据 | 人口、GDP | 2005年, 2015年 | 1 km×1 km |
表2
景观格局指数计算方法"
| 名称 | 景观指数 | 生态意义 |
|---|---|---|
| 景观破碎度指数(Ci) | 边缘密度(ED) 面积加权的平均形状因子 (SHAPE_AM) | ED用于揭示景观或类型被边界分割的程度,是景观破碎化程度的直接反应,边界密度越高,反映景观破碎度越高。SHAPE_AM是度量景观空间格局复杂性的重要指标之一,对于自然斑块或自然景观的形状分析还有另一个很显著的生态意义,即常说的边缘效应。 |
| 景观分离度指数(Ni) | 斑块结合指数 (COHESION) 聚集度指数 (AI) 集聚指数 (IJI) | COHESION指标描述的是景观里不同斑块类型的团聚程度或延展趋势,由于该指标包含空间信息,是描述景观格局的最重要的指数之一。AI来源于斑块类型水平上的邻近矩阵的计算,是反映景观聚集与分离程度的重要指标之一。IJI对那些受到某种自然条件严重制约的生态系统的分布特征反映显著。 |
| 景观优势度指数(Di) | 最大斑块指数 (LPI) | LPI有助于确定景观的模地或优势类型等,其值的大小决定着景观中的优势种、内部种的丰度等生态特征,其值的变化可以改变干扰的强度和频率,反映人类活动的方向和强弱。 |
| 景观结构指数(Si) | Si=a(ED)+b(SHAPE_AM) +c(COHESION) +d(AI) + e(IJI) + f(LPI) | 反映不同景观所代表的生态系统受到干扰的损失程度。式中:a、b、c、d、e、f为相应景观指数的权重,为避免人为赋值的主观性,研究采用CRITIC权重法进行客观赋值。 |
| 景观脆弱度指数(Fi) | 专家打分赋值获得 | 表示不同景观类型对外界干扰的敏感性,值越大,生态风险越大。景观脆弱度的大小与其在景观自然演替过程中所处的阶段有关,结合研究区特点,研究将景观类型按其脆弱度由高到低依次赋值:7裸地、6 荒漠、5 水域、4 耕地、3 草地、2 林地、1 建设用地。 |
| 景观损失度指数(Ri) | | 表示不同景观类型所代表的生态系统受到外界干扰时,其自然属性损失的程度。 |
| 景观生态风险指数(ERIi) | | 表示一个评价单元内综合生态损失度的相对大小,即评价单元内生态风险大小。式中:ERIi为第i个评价单元的景观生态风险指数;Aki为第k个评价单元内景观类型i的面积;Ak为第k个评价单元的面积。 |
表3
景观格局指数权重"
| 权重 | ||||||
|---|---|---|---|---|---|---|
| ED | SHAPE_AM | COHESION | AI | IJI | LPI | |
| 2005年 | 0.85 | 9.59 | 22.89 | 25.31 | 35.78 | 5.58 |
| 2015年 | 0.88 | 9.41 | 20.87 | 25.38 | 37.73 | 5.73 |
| 2025年自然增长情景 | 0.97 | 9.81 | 18.50 | 23.67 | 40.60 | 6.44 |
| 2025年生态保护情景 | 0.90 | 9.52 | 20.07 | 24.48 | 39.29 | 5.74 |
表4
研究区土地利用面积"
| 土地利用类型 | 面积/ km2 | |||
|---|---|---|---|---|
| 2005年 | 2015年 | 2025年 自然增长情景 | 2025年 生态保护情景 | |
| 耕地 | 1017 | 1220 | 1420 | 1265 |
| 林地 | 506 | 504 | 502 | 502 |
| 草地 | 37268 | 37190 | 37113 | 37164 |
| 水域 | 5534 | 5544 | 5554 | 5554 |
| 建设用地 | 48 | 65 | 81 | 81 |
| 荒漠 | 9358 | 9223 | 9091 | 9195 |
| 裸地 | 16055 | 16040 | 16025 | 16025 |
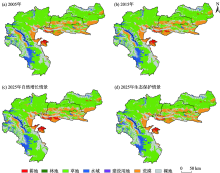
图2
研究区土地利用"

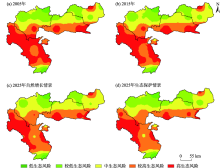
图3
景观生态风险空间分布"

表5
不同等级景观生态风险面积"
| 级别 | 2005年 | 2015年 | 2025年自然增长情景 | 2025年生态保护情景 | |||||||
|---|---|---|---|---|---|---|---|---|---|---|---|
| 面积/km2 | 比例/% | 面积/km2 | 比例/% | 面积/km2 | 比例/% | 面积/km2 | 比例/% | ||||
| 低生态风险Risk Ⅰ | 343 | 2.26 | 317 | 2.09 | 317 | 2.09 | 351 | 2.32 | |||
| 较低生态风险Risk Ⅱ | 3021 | 19.93 | 2643 | 17.44 | 2085 | 13.76 | 3325 | 21.94 | |||
| 中生态风险Risk Ⅲ | 3640 | 24.02 | 4025 | 26.56 | 4619 | 30.48 | 3924 | 25.89 | |||
| 较高生态风险Risk Ⅳ | 3583 | 23.64 | 3900 | 25.73 | 4982 | 32.87 | 5048 | 33.31 | |||
| 高生态风险Risk Ⅴ | 4568 | 30.14 | 4270 | 28.18 | 3152 | 20.80 | 2507 | 16.54 | |||
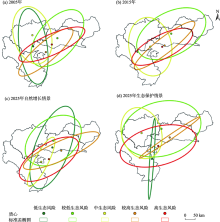
图4
景观生态风险质心与标准差椭圆"

表6
景观生态风险演化相关的各因子PD值"
| 年份 | 气温 | 降水 | 人口 | 国内生产总值 | 高程 | 坡度 |
|---|---|---|---|---|---|---|
| 2005 | 0.917 | 0.925 | 0.598 | 0.479 | 0.938 | 0.859 |
| 2015 | 0.909 | 0.894 | 0.636 | 0.131 | 0.941 | 0.857 |
| [1] |
彭建, 党威雄, 刘焱序, 等. 景观生态风险评价研究进展与展望[J]. 地理学报, 2015, 70(4):664-677.
doi: 10.11821/dlxb201504013 |
|
[ Peng Jian, Dang Weixiong, Liu Yanxu, et al. Review on landscape ecological risk assessment[J]. Acta Geographica Sinica, 2015, 70(4):664-677. ]
doi: 10.11821/dlxb201504013 |
|
| [2] |
李青圃, 张正栋, 万露文, 等. 基于景观生态风险评价的宁江流域景观格局优化[J]. 地理学报, 2019, 74(7):1420-1437.
doi: 10.11821/dlxb201907011 |
|
[ Li Qingpu, Zhang Zhengdong, Wan Luwen, et al. Landscape pattern optimization in Ningjiang River Basin based on landscape ecological risk assessment[J]. Acta Geographica Sinica, 2019, 74(7):1420-1437. ]
doi: 10.11821/dlxb201907011 |
|
| [3] |
曹祺文, 张曦文, 马洪坤, 等. 景观生态风险研究进展及基于生态系统服务的评价框架: ESRISK[J]. 地理学报, 2018, 73(5):843-855.
doi: 10.11821/dlxb201805005 |
|
[ Cao Qiwen, Zhang Xiwen, Ma Hongkun, et al. Review of landscape ecological risk and an assessment framework based on ecological services: ESRISK[J]. Acta Geographica Sinica, 2018, 73(5):843-855. ]
doi: 10.11821/dlxb201805005 |
|
| [4] | 石玉琼, 王宁练, 李团胜, 等. 榆林市景观生态风险及其时空分异[J]. 干旱区研究, 2019, 36(2):494-504. |
| [ Shi Yuqiong, Wang Ninglian, Li Tuansheng, et al. Landscape ecological risk and its spatiotemporal variation in Yulin[J]. Arid Zone Research, 2019, 36(2):494-504. ] | |
| [5] |
刘焱序, 王仰麟, 彭建, 等. 基于生态适应性循环三维框架的城市景观生态风险评价[J]. 地理学报, 2015, 70(7):1052-1067.
doi: 10.11821/dlxb201507003 |
|
[ Liu Yanxu, Wang Yanglin, Peng Jian, et al. Urban landscape ecological risk assessment based on the 3D framework of adaptive cycle[J]. Acta Geographica Sinica, 2015, 70(7):1052-1067. ]
doi: 10.11821/dlxb201507003 |
|
| [6] |
Mo Wenbo, Wang Yong, Zhang Yingxue, et al. Impacts of road network expansion on landscape ecological risk in a megacity, China: A case study of Beijing[J]. Science of the Total Environment, 2017, 574:1000-1011.
doi: 10.1016/j.scitotenv.2016.09.048 |
| [7] | 王晓峰, 延雨, 李月皓, 等. 银川市湿地景观演变及其驱动因素[J]. 干旱区研究, 2021, 38(3):855-866. |
| [ Wang Xiaofeng, Yan Yu, Li Yuehao, et al. Wetland landscape evolution and its driving factors in Yinchuan[J]. Arid Zone Research, 2021, 38(3):855-866. ] | |
| [8] | Li Jialin, Pu Ruiliang, Gong Hongbo, et al. Evolution characteristics of landscape ecological risk patterns in coastal zones in Zhejiang Province, China[J]. Sustainability-Basel, 2017, 9(4):584. |
| [9] | 潘竟虎, 刘晓. 疏勒河流域景观生态风险评价与生态安全格局优化构建[J]. 生态学杂志, 2016, 35(3):791-799. |
| [ Pan Jinghu, Liu Xiao. Landscape ecological risk assessment and landscape security pattern optimization in Shule River Basin[J]. Chinese Journal of Ecology, 2016, 35(3):791-799. ] | |
| [10] | 周亚军, 刘廷玺, 段利民, 等. 锡林河流域上游河谷湿地景观格局演变及其驱动力[J]. 干旱区研究, 2020, 37(3):580-590. |
| [ Zhou Yajun, Liu Tingxi, Duan Limin, et al. Driving force analysis and landscape pattern evolution in the up stream valley of Xilin River Basin[J]. Arid Zone Research, 2020, 37(3):580-590. ] | |
| [11] |
Shi Hui, Yang Zhaoping, Han Fang, et al. Assessing landscape ecological risk for a world natural heritage site: A case study of Bayanbulak in China[J]. Polish Journal of Environmental Studies, 2015, 24(1):269-283.
doi: 10.15244/pjoes/28685 |
| [12] | 许妍, 高俊峰, 高永年. 基于土地利用动态变化的太湖地区景观生态风险评价[J]. 湖泊科学, 2011, 23(4):642-648. |
| [ Xu Yan, Gao Junfeng, Gao Yongnian. Landscape ecological risk assessment in the Taihu region based on land use change[J]. Journal of Lake Sciences, 2011, 23(4):642-648. ] | |
| [13] |
Liu Xiaoping, Liang Xun, Li Xia, et al. A future land use simulation model (FLUS) for simulating multiple land use scenarios by coupling human and natural effects[J]. Landscape and Urban Planning, 2017, 168:94-116.
doi: 10.1016/j.landurbplan.2017.09.019 |
| [14] | 秦埼瑞, 李雪梅, 陈庆伟, 等. 基于FLUS模型的天山山区未来土地利用变化预估[J]. 干旱区研究, 2019, 36(5):1270-1279. |
| [ Qin Qirui, Li Xuemei, Chen Qingwei, et al. Estimation of future land use change in the Tianshan Mountainous based on FLUS model[J]. Arid Zone Research, 2019, 36(5):1270-1279. ] | |
| [15] | 王明常, 郭鑫, 王凤艳, 等. 基于FLUS的长春市土地利用动态变化与预测分析[J]. 吉林大学学报(地球科学版), 2019, 49(6):1795-1804. |
| [ Wang Mingchang, Guo Xin, Wang Fengyan, et al. Dynamic change and predictive analysis of land use types in Changchun City based on FLUS model[J]. Journal of Jilin University (Earth Science Edition), 2019, 49(6):1795-1804. ] | |
| [16] | 曹帅, 金晓斌, 杨绪红, 等. 耦合MOP与GeoSOS-FLUS模型的县级土地利用结构与布局复合优化[J]. 自然资源学报, 2019, 34(6):1171-1185. |
| [ Cao Shuai, Jin Xiaobin, Yang Xuhong, et al. Coupled MOP and GeoSOS-FLUS models research on optimization of land use structure and layout in Jintan district[J]. Journal of Natural Resources, 2019, 34(6):1171-1185. ] | |
| [17] |
孙定钊, 梁友嘉. 基于改进Markov-CA模型的黄土高原土地利用多情景模拟[J]. 地球信息科学学报, 2021, 23(5):825-836.
doi: 10.12082/dqxxkx.2021.200283 |
|
[ Sun Dingzhao, Liang Youjia. Multi-scenario simulation of land use dynamic in the Loess Plateau using an improved Markov-CA model[J]. Journal of Geo-information Science, 2021, 23(5):825-836. ]
doi: 10.12082/dqxxkx.2021.200283 |
|
| [18] | 李志明, 宋戈, 鲁帅, 等. 基于CA-Markov模型的哈尔滨市土地利用变化预测研究[J]. 中国农业资源与区划, 2017, 38(12):41-48. |
| [ Li Zhiming, Song Ge, Lu Shuai, et al. Change and prediction of the land use in Harbin City based on CA-Markov model[J]. Chinese Journal of Agricultural Resources and Regional Planning, 2017, 38(12):41-48. ] | |
| [19] |
朱文博, 张静静, 崔耀平, 等. 基于土地利用变化情景的生态系统碳储量评估——以太行山淇河流域为例[J]. 地理学报, 2019, 74(3):446-459.
doi: 10.11821/dlxb201903004 |
|
[ Zhu Wenbo, Zhang Jingjing, Cui Yaoping, et al. Assessment of territorial ecosystem carbon storage based on land use change scenario: A case study in Qihe River Basin[J]. Acta Geographica Sinica, 2019, 74(3):446-459. ]
doi: 10.11821/dlxb201903004 |
|
| [20] | 刘春艳, 张科, 刘吉平. 1976—2013年三江平原景观生态风险变化及驱动力[J]. 生态学报, 2018, 38(11):3729-3740. |
| [ Liu Chunyan, Zhang Ke, Liu Jiping. A long-term site study for the ecological risk migration of landscapes and its driving forces in the Sanjiang Plain from 1976 to 2013[J]. Acta Ecologica Sinica, 2018, 38(11):3729-3740. ] | |
| [21] | 娄妮, 王志杰, 何嵩涛. 基于景观格局的阿哈湖国家湿地公园景观生态风险评价[J]. 水土保持研究, 2020, 27(1):233-239. |
| [ Lou Ni, Wang Zhijie, He Songtao. Assessment on ecological risk of Aha Lake national wetland park based on landscape pattern[J]. Research of Soil and Water Conservation, 2020, 27(1):233-239. ] | |
| [22] | 谢小平, 陈芝聪, 王芳, 等. 基于景观格局的太湖流域生态风险评估[J]. 应用生态学报, 2017, 28(10):3369-3377. |
| [ Xie Xiaoping, Chen Zhicong, Wang Fang, et al. Ecological risk assessment of Taihu Lake basin based on landscape pattern[J]. Chinese Journal of Applied Ecology, 2017, 28(10):3369-3377. ] | |
| [23] | 张行, 陈海, 史琴琴, 等. 陕西省景观生态脆弱性时空演变及其影响因素[J]. 干旱区研究, 2020, 37(2):496-505. |
| [ Zhang Hang, Chen Hai, Shi Qinqin, et al. Spatiotemporal evolution and driving factors of landscape ecological vulnerability in Shaanxi Province[J]. Arid Zone Research, 2020, 37(2):496-505. ] | |
| [24] | 吕乐婷, 张杰, 孙才志, 等. 基于土地利用变化的细河流域景观生态风险评估[J]. 生态学报, 2018, 38(16):5952-5960. |
| [ Lyu Leting, Zhang Jie, Sun Caizhi, et al. Landscape ecological risk assessment of Xi river Basin based on land-use change[J]. Acta Ecologica Sinica, 2018, 38(16):5952-5960. ] | |
| [25] | 黄木易, 何翔. 近20年来巢湖流域景观生态风险评估与时空演化机制[J]. 湖泊科学, 2016, 28(4):785-793. |
| [ Huang Muyi, He Xiang. Landscape ecological risk assessment and its mechanism in Chaohu Basin during the past almost 20 years[J]. Journal of Lake Sciences, 2016, 28(4):785-793. ] | |
| [26] | 刘世梁, 刘琦, 张兆苓, 等. 云南省红河流域景观生态风险及驱动力分析[J]. 生态学报, 2014, 34(13):3728-3734. |
| [ Liu Shiliang, Liu Qi, Zhang Zhaoling, et al. Landscape ecological risk and driving force analysis in the Red River Basin[J]. Acta Ecologica Sinica, 2014, 34(13):3728-3734. ] | |
| [27] | 张月, 张飞, 周梅, 等. 干旱区内陆艾比湖区域景观生态风险评价及时空分异[J]. 应用生态学报, 2016, 27(1):233-242. |
| [ Zhang Yue, Zhang Fei, Zhou Mei, et al. Landscape ecological risk assessment and its spatio-temporal variations in Ebinur Lake region of inland arid area[J]. Chinese Journal of Applied Ecology, 2016, 27(1):233-242. ] | |
| [28] | 王昆, 宋海洲. 三种客观权重赋权法的比较分析[J]. 技术经济与管理研究, 2003, 24(6):48-49. |
| [ Wang Kun, Song Haizhou. A comparative analysis of three objective weighting methods[J]. Journal of Technical Economics & Management, 2003, 24(6):48-49. ] | |
| [29] | 李翔, 李学军. 南疆三地州自我发展能力的测度及实证分析[J]. 新疆社科论坛, 2014, 26(4):57-62. |
| [ Li Xiang, Li Xuejun. Measurement and empirical analysis of self-development capacity of three southern Xinjiang prefectures[J]. Tribune of Social Sciences in Xinjiang, 2014, 26(4):57-62. ] | |
| [30] |
Pontius R G, Walker R, Yao-Kumah R, et al. Accuracy assessment for a simulation model of Amazonian deforestation[J]. Annals of the Association of American Geographers, 2007, 97(4):677-695.
doi: 10.1111/j.1467-8306.2007.00577.x |
| [31] |
赵林峰, 刘小平, 刘鹏华, 等. 基于地理分区与FLUS模型的城市扩张模拟与预警[J]. 地球信息科学学报, 2020, 22(3):517-530.
doi: 10.12082/dqxxkx.2020.190477 |
|
[ Zhao Linfeng, Liu Xiaoping, Liu Penghua, et al. Urban expansion simulation and early warning based on geospatial partition and FLUS model[J]. Journal of Geo-information Science, 2020, 22(3):517-530. ]
doi: 10.12082/dqxxkx.2020.190477 |
|
| [32] | 陈海珍, 石铁柱, 邬国锋. 武汉市湖泊景观动态遥感分析(1973-2013年)[J]. 湖泊科学, 2015, 27(4):745-754. |
| [ Chen Haizhen, Shi Tiezhu, Wu Guofeng. The dynamic analysis of lake landscape of Wuhan City in recent 40 years[J]. Journal of Lake Sciences, 2015, 27(4):745-754. ] | |
| [33] | 张彧瑞, 马金珠, 齐识. 人类活动和气候变化对石羊河流域水资源的影响——基于主客观综合赋权分析法[J]. 资源科学, 2012, 34(10):1922-1928. |
| [ Zhang Yurui, Ma Jinzhu, Qi Shi. Human activities, climate change and water resources in the Shiyang Basin[J]. Resources Science, 2012, 34(10):1922-1928. ] | |
| [34] | 苏海民, 何爱霞. 基于RS和地统计学的福州市土地利用分析[J]. 自然资源学报, 2010, 25(1):91-99. |
| [ Su Haiming, He Aixia. Analysis of land use based on RS and geostatistics in Fuzhou City[J]. Journal of Natural Resources, 2010, 25(1):91-99. ] | |
| [35] | 王芳, 陈芝聪, 谢小平. 太湖流域建设用地与耕地景观时空演变及驱动力[J]. 生态学报, 2018, 38(9):3300-3310. |
| [ Wang Fang, Chen Zhicong, Xie Xiaoping. Analysis of spatial-temporal evolution and it's driving forces of construction land and cultivated landscape in Taihu Lake Basin[J]. Acta Ecologica Sinica, 2018, 38(9):3300-3310. ] | |
| [36] |
Achilleos G A. The inverse distance weighted interpolation method and error propagation mechanism-creating a DEM from an analogue topographical map[J]. Journal of Spatial Science, 2011, 56(2):283-304.
doi: 10.1080/14498596.2011.623348 |
| [37] | 卢世俊. 乌鲁木齐城市空间扩展特征及驱动机制[J/OL]. 武汉大学学报(信息科学版), 2020. https://doi.org/10.13203/j.whugis20200119. |
| [ Lu Shijun. Characteristics and driving mechanism of urban space expansion in Urumqi[J/OL]. Geomatics and Information Science of Wuhan University, 2020. https://doi.org/10.13203/j.whugis20200119. ] | |
| [38] |
王劲峰, 徐成东. 地理探测器: 原理与展望[J]. 地理学报, 2017, 72(1):116-134.
doi: 10.11821/dlxb201701010 |
|
[ Wang Jinfeng, Xu Chengdong. Geodetector: Principle and prospective[J]. Acta Geographica Sinica, 2017, 72(1):116-134. ]
doi: 10.11821/dlxb201701010 |
|
| [39] | 李玮麒, 兰泽英, 陈德权, 等. 广州市土地利用多情景模拟及其生态风险时空响应[J]. 水土保持通报, 2020, 40(4):204-210. |
| [ Li Weiqi, Lan Zeying, Chen Dequan, et al. Multi-scenario simulation of land use and its spatial-temporal response to ecological risk in Guangzho City[J]. Bulletin of Soil and Water Conservation, 2020, 40(4):204-210. ] | |
| [40] | 于涛, 沈浩, 仲嘉亮. 基于CA-Markov模型的新疆克州土地利用动态模拟研究[J]. 新疆环境保护, 2008, 30(1):11-14. |
| [ Yu Tao, Shen Hao, Zhong Jialiang. Dynamic analogue research of land utilization of Kizilsu Kirgiz Autonomous Prefecture Xinjiang base on CA-Markov model[J]. Environmental Protection of Xinjiang, 2008, 30(1):11-14. ] |
| [1] | 李小锋, 惠婷婷, 李耀明, 毛洁菲, 王光宇, 范连连. 不同放牧管理方式对新疆山地草原植物群落特征的影响[J]. 干旱区研究, 2024, 41(1): 124-134. |
| [2] | 刘一丹, 姚晓军, 李宗省, 胡家瑜. 气候变化和土地利用覆盖变化对河西地区植被净初级生产力的影响[J]. 干旱区研究, 2024, 41(1): 169-180. |
| [3] | 李永广, 苑广辉. 青海湖流域不同下垫面类型对地表温度的生物物理影响[J]. 干旱区研究, 2024, 41(1): 24-35. |
| [4] | 马瑶瑶, 史培军, 徐伟, 张钢锋. 干旱区水电站建设运营生态环境影响遥感监测[J]. 干旱区研究, 2023, 40(9): 1498-1508. |
| [5] | 汪翔, 吕海深, 朱永华, 郭晨煜. 两种河道洪水演进方法在新疆山区的应用比较[J]. 干旱区研究, 2023, 40(8): 1240-1247. |
| [6] | 王超, 马占仓, 潘成南, 吴星月, 宋文丹, 阎平. 新疆苋属新记录植物[J]. 干旱区研究, 2023, 40(8): 1280-1288. |
| [7] | 古丽斯旦·艾尼瓦尔, 吐尔洪·努尔东, 地力胡马尔·阿不都克热木, 买买提明·苏来曼. 新疆薄罗藓科植物新记录[J]. 干旱区研究, 2023, 40(8): 1289-1293. |
| [8] | 文妙霞, 何学高, 刘欢, 张婧, 罗晨, 贾丰铭, 王义贵, 胡云云. 基于地理探测器的宁夏草地植被覆被时空分异及驱动因子[J]. 干旱区研究, 2023, 40(8): 1322-1332. |
| [9] | 李虹, 李忠勤, 陈普晨, 彭加加. 近20 a新疆阿尔泰山积雪时空变化及其影响因素[J]. 干旱区研究, 2023, 40(7): 1040-1051. |
| [10] | 孟乘枫, 仲涛, 郑江华, 王南, 刘泽轩, 任祥源. 昆仑山冰湖分布时空特征及驱动力[J]. 干旱区研究, 2023, 40(7): 1094-1106. |
| [11] | 许君利, 韩海东, 王建. 新疆大气PM2.5来源与潜在贡献源分析[J]. 干旱区研究, 2023, 40(6): 874-884. |
| [12] | 薛一波, 黄双燕, 张小啸, 雷加强, 李生宇. 新疆2018年冬季雨雪风沙强降尘事件[J]. 干旱区研究, 2023, 40(5): 681-690. |
| [13] | 赵克明, 孙鸣婧, 李霞, 施俊杰, 安大维, 许婷婷. 两种典型大气扩散指数在新疆的分布特征及其适用性对比[J]. 干旱区研究, 2023, 40(5): 691-702. |
| [14] | 王鹏, 秦思彤, 胡慧蓉. 近30 a拉萨河流域土地利用变化和生境质量的时空演变特征[J]. 干旱区研究, 2023, 40(3): 492-503. |
| [15] | 张恩月,郑君焱,苏迎庆,张蕾,张鹏飞,刘庚. 基于情景模拟的流域低碳土地利用格局优化研究——以汾河流域为例[J]. 干旱区研究, 2023, 40(2): 203-212. |
|
||