干旱区研究 ›› 2023, Vol. 40 ›› Issue (5): 691-702.doi: 10.13866/j.azr.2023.05.02
赵克明1( ),孙鸣婧1,李霞2(),施俊杰1,安大维1,许婷婷1
收稿日期:2023-01-09
修回日期:2023-03-21
出版日期:2023-05-15
发布日期:2023-05-30
通讯作者:
李霞. E-mail: 作者简介:赵克明(1983-),男,高级工程师,主要从事短期天气预报和大气环境研究. E-mail: 基金资助:
ZHAO Keming1(),SUN Mingjing1,LI Xia2(),SHI Junjie1,AN Dawei1,XU Tingting1
Received:2023-01-09
Revised:2023-03-21
Online:2023-05-15
Published:2023-05-30
摘要:
为定量评估气象条件对空气污染的作用,利用2010—2020年新疆14个气象探空站及地面气象观测站资料计算大气自净能力指数和静稳指数,对比分析两者在新疆的时空分布特征及其适用性,结果表明:新疆的大气自净能力指数与静稳指数呈反位相分布,两者具有较好的相关性,相关系数达-0.89。大气自净能力指数在夏季最大[9.4 t·(d·km2)-1],冬季最小[0.9 t·(d·km2)-1],南疆[6.2 t·(d·km2)-1]普遍大于北疆[6.0 t·(d·km2)-1];静稳指数在冬季最大(5.1),夏季最小(0.7),南疆(1.6)普遍小于北疆(3.8),即南疆的大气扩散条件较北疆好,北疆较南疆更容易形成静稳天气。通过分析2015—2020年大气环境监测站逐日污染数据发现,大气自净能力指数和静稳指数在天山北坡对PM2.5和PM10均有较好的指示意义;在阿勒泰两个指数对PM2.5有较好的指示意义;在阿克苏静稳指数与PM2.5的相关关系通过了显著性检验;在和田自净能力指数与PM10通过了显著性检验。对于首府乌鲁木齐,当污染物排放严重时,若大气自净能力指数在0~20 t·(d·km2)-1,则易出现重污染天气;静稳指数范围参考意义不大。
赵克明, 孙鸣婧, 李霞, 施俊杰, 安大维, 许婷婷. 两种典型大气扩散指数在新疆的分布特征及其适用性对比[J]. 干旱区研究, 2023, 40(5): 691-702.
ZHAO Keming, SUN Mingjing, LI Xia, SHI Junjie, AN Dawei, XU Tingting. Comparison of the distribution and applicability of two typical atmospheric diffusion indices in Xinjiang[J]. Arid Zone Research, 2023, 40(5): 691-702.
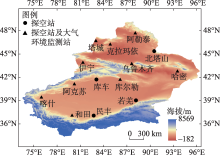
图1
新疆14个探空站分布示意图 注:底图采用新疆维吾尔自治区自然资源厅标准地图制作,新S(2019)204号,对底图边界无修改。下同。"
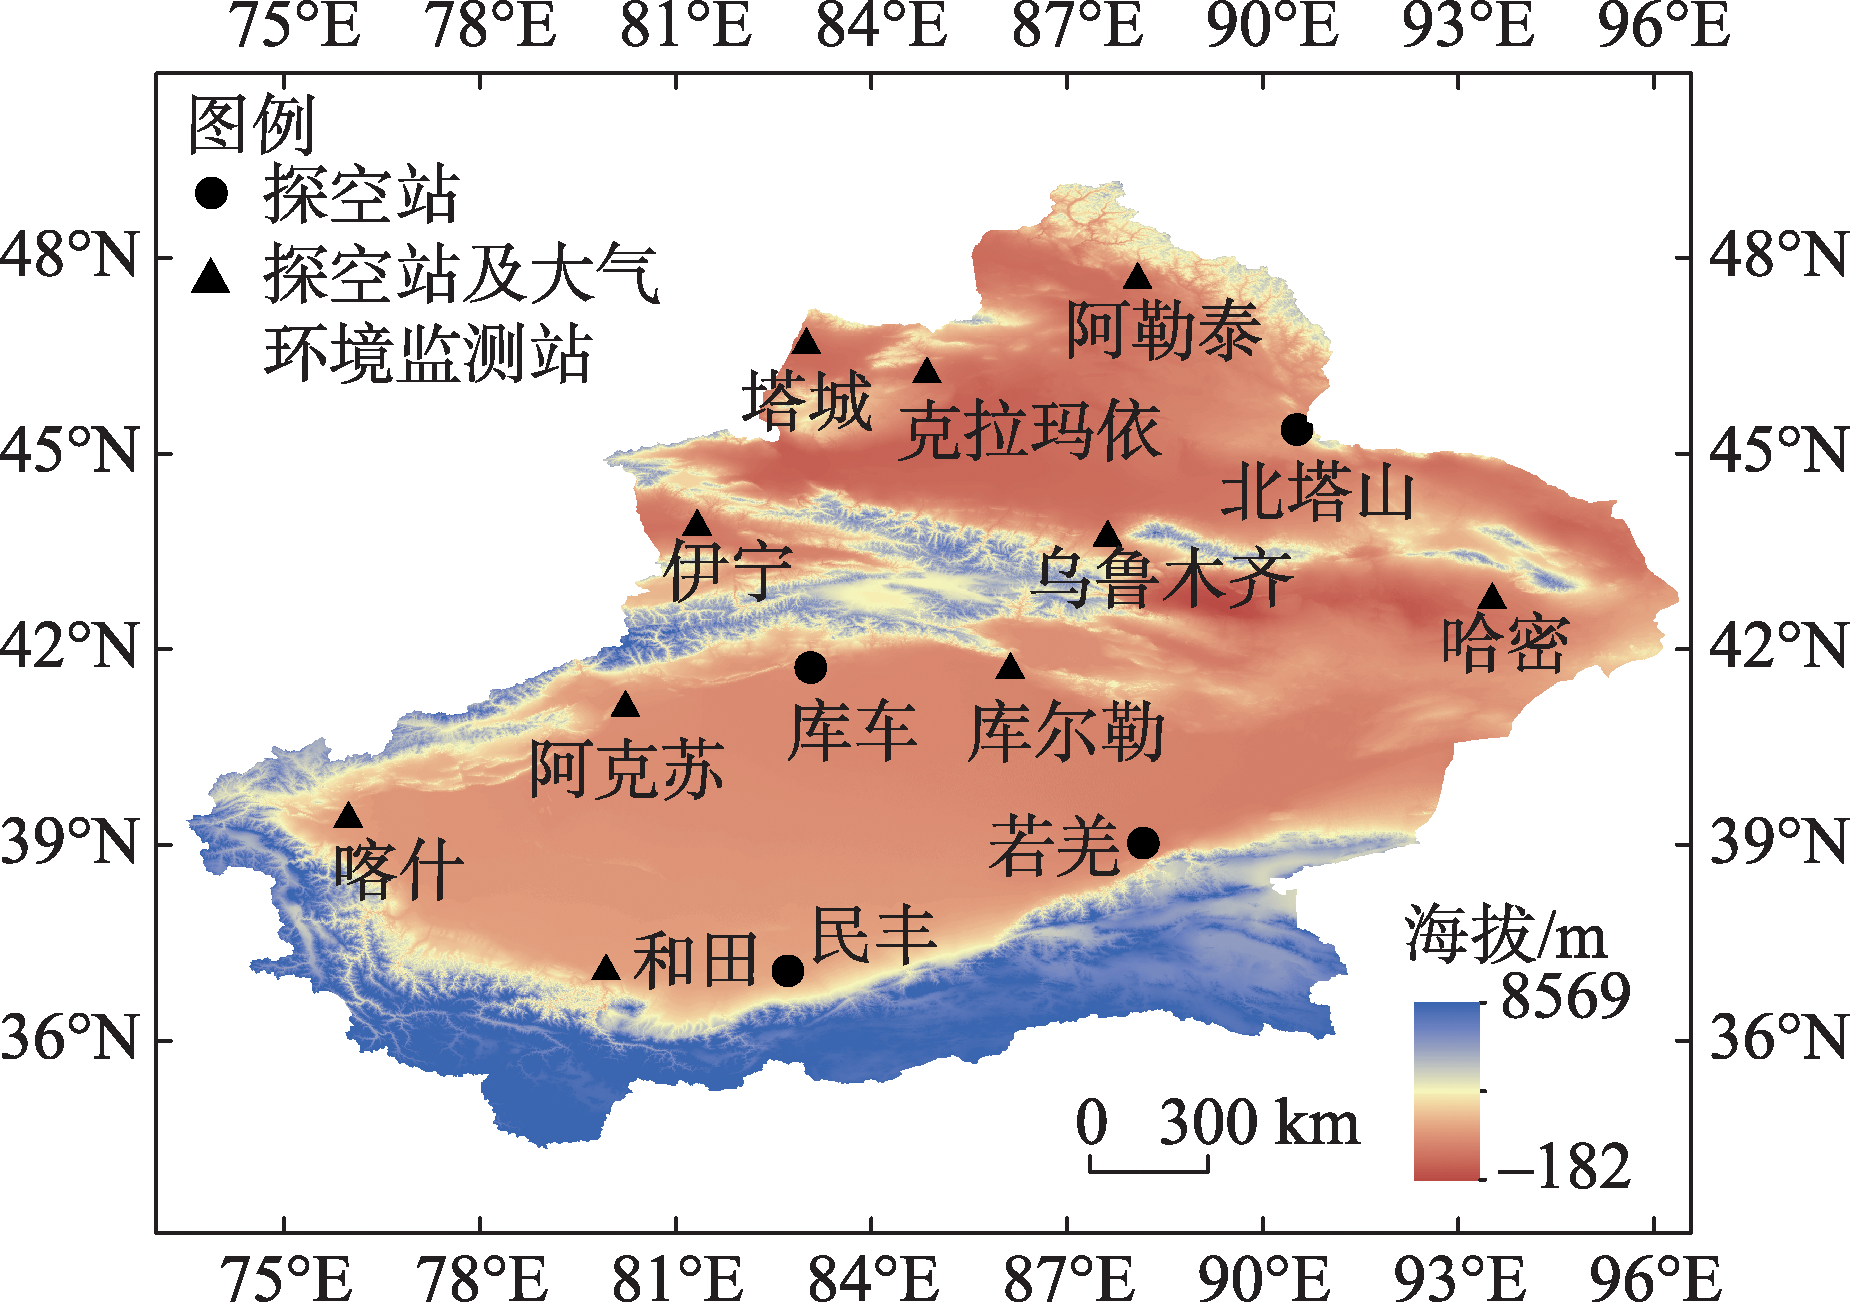
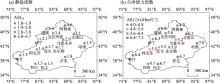
图2
2010—2020年大气自净能力指数和静稳指数年平均分布"
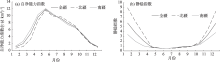
图3
2010—2020年新疆14个探空站大气自净能力指数和静稳指数的逐月变化"

表1
新疆不同地区大气自净能力指数和静稳指数的季节分布"
| 指数 | 季节 | 全疆 | 南疆 | 北疆 |
|---|---|---|---|---|
| 大气自净 能力指数 | 春 | 7.8 | 9.6 | 8.8 |
| 夏 | 9.4 | 9.0 | 9.2 | |
| 秋 | 4.5 | 4.5 | 4.5 | |
| 冬 | 0.9 | 1.7 | 1.4 | |
| 静稳指数 | 春 | 1.1 | 0.8 | 4.6 |
| 夏 | 0.7 | 0.7 | 0.6 | |
| 秋 | 1.9 | 1.6 | 2.4 | |
| 冬 | 5.1 | 3.1 | 7.7 |
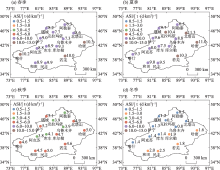
图4
2010—2020年不同季节大气自净能力指数的空间分布"

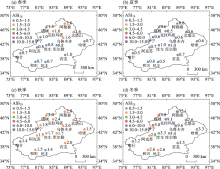
图5
2010—2020年不同季节静稳指数的空间分布"

表2
不同区域大气自净能力指数与静稳指数的相关系数"
| 南疆 | 北疆 | 全疆 | |
|---|---|---|---|
| 站数/个 | 5 | 5 | 10 |
| 时间样本/个 | 60 | 60 | 60 |
| 相关系数 | -0.86* | -0.89* | -0.89* |
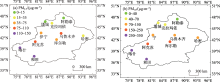
图6
2015—2020年新疆PM2.5(a)和PM10(b)年平均浓度空间分布"

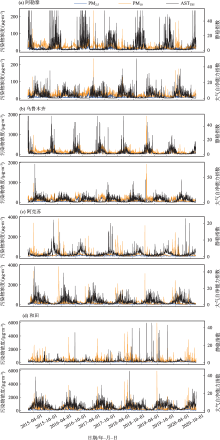
图7
大气自净能力指数和静稳指数与PM2.5、PM10的逐日时间序列"

表3
代表城市日大气自净能力指数和静稳指数与PM2.5、PM10浓度的相关系数"
| 指数 | 污染物 | 阿勒泰 | 乌鲁木齐 | 阿克苏 | 和田 |
|---|---|---|---|---|---|
| 静稳指数 | PM2.5 | 0.24* | 0.37* | 0.17* | -0.01 |
| PM10 | 0 | 0.25* | 0.03 | -0.01 | |
| 大气自净能力指数 | PM2.5 | -0.23* | -0.4* | -0.05 | 0.1 |
| PM10 | 0.03 | -0.27* | 0.01 | 0.13* |
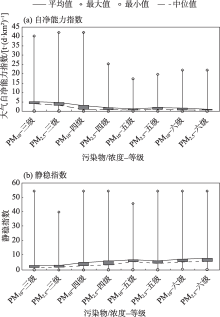
图8
不同污染等级下大气自净能力指数和静稳指数的分布"

| [1] | 藏晓芳, 邓文叶, 王志煌. 新疆“十三五”城市空气质量评价分析[J]. 新疆环境保护, 2021, 43(1): 1-9. |
| [Zang Xiaofang, Deng Wenye, Wang Zhihuang. Evaluation of urban air quality in Xinjiang during the 13th five-year plan period[J]. Xinjiang Environmental Protection, 2021, 43(1): 1-9. ] | |
| [2] | Guo S, Hu M, Zamora M L, et al. Elucidating severe urban haze formation in China[J]. Proceedings of the National Academy of Sciences of the United States of America, 2014, 49(111): 17373-17378. |
| [3] |
Zhang R H, Li Q, Zhang R N. Meteorological conditions for the persistent severe fog and haze event over eastern China in January 2013[J]. Science China: Earth Sciences, 2014, 57: 26-35.
doi: 10.1007/s11430-013-4774-3 |
| [4] |
Wang Z F, Li J, Wang Z, et al. Modeling study of regional severe hazes over mid-eastern China in January 2013 and its implications on pollution prevention and control[J]. Science China: Earth Sciences, 2014, 57: 3-13.
doi: 10.1007/s11430-013-4793-0 |
| [5] | 吴兑. 关于霾与雾的区别和灰霾天气预警的讨论[J]. 气象, 2005, 31(4): 3-7. |
| [Wu Dui. A Discussion on difference between haze and fog and warning of ash haze weather[J]. Meteorological Monthly, 2005, 31(4): 3-7. ] | |
| [6] |
Ding A J, Huang H, Nie W, et al. Enhanced haze pollution by black carbon in megacities in China[J]. Geophysical Research Letters, 2016, 43(6): 2873-2879.
doi: 10.1002/grl.v43.6 |
| [7] | Che H, Zhang X, Li Y, et al. Horizontal visibility trends in China 1981-2005[J]. Geophysical Research Letters, 2007, 34(24): 497-507. |
| [8] | 朱蓉, 张存杰, 梅梅. 大气自净能力指数的气候特征与应用研究[J]. 中国环境科学, 2018, 38(10): 3601-3610. |
| [Zhu Rong, Zhang Cunjie, Mei Mei. The climate characteristics of atmospheric self-cleaning ability index and its application in China[J]. China Environmental Science, 2018, 38(10): 3601-3610. ] | |
| [9] | Ma Yongjing, Ye Jianhuai, Xin Jinyuan, et al. The stove, dome, and umbrella effects of atmospheric aerosol on the development of the planetary boundary layer in hazy regions[J]. Geophysical Research Letters, 2020, 47(13): e2020GL087373. |
| [10] | Wang L L, Wang Y S, Sun Y, et al. Using synoptic classification and trajectory analysis to assess air quality during the winter heating period in Urumqi[J]. Advance in Atmospheric Science, 2012, 29(2): 307-319. |
| [11] | Wang Z L, Huang X, Ding A J. Dome effect of black carbon and its key influencing factors: A one-dimensional modelling study[J]. Atmospheric Chemistry & Physics, 2018, 18(4): 2821-2834. |
| [12] | 赵晨曦, 王云琦, 王玉杰, 等. 北京地区冬春PM2. 5和PM10污染水平时空分布及其与气象条件的关系[J]. 环境科学, 2014, 35(2): 418-427. |
| [Zhao Chenxi, Wang Yunqi, Wang Yujie, et al. Temporal and spatial distribution of PM2.5 and PM10 pollution status and the correlation of particulate matters and meteorological factors during winter and spring in Beijing[J]. Environmental Science, 2014, 35(2): 418-427. ] | |
| [13] | 潘晨, 康志明. 2001—2019年气象条件对江苏PM2.5分布的影响[J]. 环境科学, 2022, 43(2): 649-662. |
| [Pan Chen, Kang Zhiming. Impact of meteorological conditions on PM2.5 in Jiangsu province from 2001 to 2019[J]. Environmental Science, 2022, 43(2): 649-662. ] | |
| [14] | Chen C, Sun Y L, Xu W Q, et al. Characteristics and sources of submicron aerosols above the urban canopy (260 m) in Beijing China during the 2014 APEC summit[J]. Atmospheric Chemistry and Physics, 2015, 15(22): 12879-12895. |
| [15] | Zhao X J, Zhao P S, Xu J, et al. Analysis of a winter regional haze event and its formation mechanism in the North China Plain[J]. Atmospheric Chemistry and Physics, 2013, 13(11): 5685-5696. |
| [16] | 王健, 吴彦, 刘晖. 乌鲁木齐市地面风场特征及其对空气污染影响初探[J]. 新疆环境保护, 2008, 30(3): 24-28. |
| [Wang Jian, Wu Yan, Liu Hui. Characteristics of surface wind field and its impact on air pollution in Urumqi[J]. Xinjiang Environmental Protection, 2008, 30(3): 24-28. ] | |
| [17] | 赵克明, 李霞, 杨静. 乌鲁木齐大气最大混合层厚度变化的环境响应[J]. 干旱区研究, 2011, 28(3): 509-513. |
| [Zhao Keming, Li Xia, Yang Jing. Envirenmental response to variation of the atmospheric maximum mixing depth in Urumqi[J]. Arid Zone Research, 2011, 28(3): 509-513. ] | |
| [18] | 闵月. 天山北坡乌昌石地区污染天气过程的气象特征研究[D]. 兰州: 兰州大学, 2020: 16-24. |
| [Min Yue. The Meteorological Characteristics of Air Pollution in Northern Slope of Tianshan Mountains[D]. Lanzhou: Lanzhou University, 2020: 16-24. ] | |
| [19] | 苏秋芳, 冯鑫媛, 韩晶晶, 等. 2014年冬季至2017年春季干、湿西南涡活动对四川盆地空气污染影响的对比研究[J]. 气象与环境科学, 2019, 42(3): 78-85. |
| [Su Qiufang, Feng Xinyuan, Han Jingjing, et al. Comparative study on the effect of dry and wet southwest vortex activity on air pollution in Sichuan Basin from winter 2014 to spring 2017[J]. Meteorological and Environmental Sciences, 2019, 42(3): 78-85. ] | |
| [20] | 林廷坤, 屈坤, 严宇, 等. 北京市秋冬季环流型下的细颗粒物传输[J]. 中国环境科学, 2021, 41(2): 548-557. |
| [Lin Tingkun, Qu Kun, Yan Yu, et al. Fine particulate matter transport driven by circulation types in autumn and winter over Beijing area[J]. China Environmental Science, 2021, 41(2): 548-557. ] | |
| [21] |
Cai W J, Li K, Liao H, et al. Weather conditions conducive to Beijing severe haze more frequent under climate change[J]. Nature Climate Change, 2017, 7: 257-262.
doi: 10.1038/nclimate3249 |
| [22] | Zhao X J, Zhao P S, Xu J, et al. Analysis of a winter regional haze event and its formation mechanism in the North China Plain[J]. Atmospheric Chemistry and Physics, 2013, 13(11): 5685-5696. |
| [23] | Han Z, Zhou B, Xu Y. Projected changes in haze pollution potential in China: An ensemble of regional climate model simulations[J]. Atmospheric Chemistry and Physics, 2017, 17: 10109-10123. |
| [24] | 国家气候中心, 国家气象中心,. 大气自净能力等级(GB/T34299-2017)[S]. 北京: 中华人民共和国国家质量监督检验检疫总局, 中国国家标准化管理委员会, 2017. |
| [National Climate Centre, National Meteorological Center. Grads of Atmospheric Self-purification Capability (GB/T34299-2017)[S]. Beijing: General Administration of Quality Supervision, Inspection and Quarantine of the People’s Republic of China, Standardization Administration of China, 2017. ] | |
| [25] | 罗玉, 陈超, 张天宇, 等. 1981—2017年四川省大气自净能力变化特征分析[J]. 中国环境科学, 2021, 41(2): 527-536. |
| [Luo Yu, Chen Chao, Zhang Tianyu, et al. Analysis on the characteristics of atmospheric self-cleaning ability index in Sichuan Province from 1981 to 2017[J]. China Environmental Science, 2021, 41(2): 527-536. ] | |
| [26] | 刘美, 姬兴杰, 左璇, 等. 1961—2019年黄河流域大气自净能力指数变化特征分析[J]. 中国环境科学, 2021, 41(12): 5591-5601. |
| [Liu Mei, Ji Xingjie, Zuo Xuan. Variation characteristics of atmospheric self-purification capacity index over the Yellow River Basin during 1961-2019[J]. China Environmental Science, 2021, 41(12): 5591-5601. ] | |
| [27] | Huang Q Q, Cai X H, Wang J, et al. Climatological study of the boundary-layer air stagnation index for China and its relationship with air pollution[J]. Atmospheric Chemistry and Physics, 2018, 18: 7573-7593. |
| [28] | 孙鸣婧, 李霞, 赵克明, 等. 基于探空数据的新疆大气扩散条件时空分布特征分析[J]. 干旱区地理, 2022, 45(1): 113-121. |
| [Sun Mingjing, Li Xia, Zhao Keming, et al. Spatial and temporal characteristics of atmospheric diffusion conditions in Xinjiang based on radiosonde data[J]. Arid Land Geography, 2022, 45(1): 113-121. ] | |
| [29] |
郭宇宏, 迪丽努尔·塔力甫, 康宏, 等. 新疆部分城市可吸入颗粒物的浓度及粒径分布[J]. 环境科学与技术, 2012, 35(S12): 240-244.
doi: 10.1021/es0010507 |
|
[Guo Yuhong, Dilnur Talip, Kang Hong, et al. The size distribution of fine particle matters in some cities in Xinjiang[J]. Environmental Science and Technology, 2012, 35(S12): 240-244. ]
doi: 10.1021/es0010507 |
|
| [30] | 马禹, 王旭, 黄镇, 等. 新疆沙尘天气的演化特征及影响因子[J]. 干旱区地理, 2006, 29(2): 178-185. |
| [Ma Yu, Wang Xu, Huang Zhen. Evolutionary characteristics and influencing factors of sand dust weather in Xinjiang[J]. Arid Land Geography, 2006, 29(2): 178-185. ] | |
| [31] | 王式功, 姜大膀, 杨德保, 等. 兰州市区最大混合层厚度变化特征分析[J]. 高原气象, 2000, 19(3): 363-369. |
| [Wang Shigong, Jiang Dabang, Yang Debao, et al. A study on characteristics of change of maximum mixing depths in Lanzhou[J]. Plateau Meteorology, 2000, 19(3): 363-370. ] | |
| [32] |
Jin F, Quan J, Hong L. et al. An air stagnation index to qualify extreme haze events in northern China[J]. Journal of the Atmospheric Sciences, 2018, 75: 3489-3506.
doi: 10.1175/JAS-D-17-0354.1 |
| [33] |
张天宇, 张丹, 王勇. 等. 1951—2018年重庆主城区大气自净能力变化特征分析[J]. 高原气象, 2019, 38(4): 901-910.
doi: 10.7522/j.issn.1000-0534.2019.00030 |
|
[Zhang Tianyu, Zhang Dan, Wang Yong, et al. analysis of variation characteristics of atmospheric self-pollution capability in the main urban area of Chong Qing from 1951-2018[J]. Plateau Meteorology, 2019, 38(4): 901-910. ]
doi: 10.7522/j.issn.1000-0534.2019.00030 |
|
| [34] | 井元元, 李宏宇, 张婧, 等. 1961—2017年华北区域大气自净能力变化特征及其影响因素分析[J]. 热带气象学报, 2021, 37(2): 233-244. |
| [Jing Yuanyuan, Li Hongyu, Zhang Jing. Analysis of characteristics and influencing factors of atmosphere self-purification capacity in north China during 1961-2017[J]. Journal of Tropical Meteorology, 2021, 37(2): 233-244. ] | |
| [35] | 谢运兴, 唐晓, 郭宇宏, 等. 新疆大气颗粒物的时空分布特征[J]. 中国环境监测, 2019, 35(1): 26-36. |
| [Xie Yunxing, Tang Xiao, Guo Yuhong. Spatial and temporal distribution of atmospheric particulate matter in Xinjiang[J]. Environmental Monitoring in China, 2019, 35(1): 26-36. ] |
| [1] | 李小锋, 惠婷婷, 李耀明, 毛洁菲, 王光宇, 范连连. 不同放牧管理方式对新疆山地草原植物群落特征的影响[J]. 干旱区研究, 2024, 41(1): 124-134. |
| [2] | 陈爱军,张寅,楚志刚. 基于FY-4A QPE的中亚五国降水时空分布特征[J]. 干旱区研究, 2023, 40(9): 1369-1381. |
| [3] | 汪翔, 吕海深, 朱永华, 郭晨煜. 两种河道洪水演进方法在新疆山区的应用比较[J]. 干旱区研究, 2023, 40(8): 1240-1247. |
| [4] | 马继龙, 史军辉, 王新英, 阿丽亚·拜都热拉, 刘茂秀, 艾吉尔·阿不拉. 洪水漫溢对塔里木河中游河岸胡杨林土壤有机碳及活性组分的影响[J]. 干旱区研究, 2023, 40(8): 1248-1257. |
| [5] | 王超, 马占仓, 潘成南, 吴星月, 宋文丹, 阎平. 新疆苋属新记录植物[J]. 干旱区研究, 2023, 40(8): 1280-1288. |
| [6] | 古丽斯旦·艾尼瓦尔, 吐尔洪·努尔东, 地力胡马尔·阿不都克热木, 买买提明·苏来曼. 新疆薄罗藓科植物新记录[J]. 干旱区研究, 2023, 40(8): 1289-1293. |
| [7] | 李虹, 李忠勤, 陈普晨, 彭加加. 近20 a新疆阿尔泰山积雪时空变化及其影响因素[J]. 干旱区研究, 2023, 40(7): 1040-1051. |
| [8] | 许君利, 韩海东, 王建. 新疆大气PM2.5来源与潜在贡献源分析[J]. 干旱区研究, 2023, 40(6): 874-884. |
| [9] | 薛一波, 黄双燕, 张小啸, 雷加强, 李生宇. 新疆2018年冬季雨雪风沙强降尘事件[J]. 干旱区研究, 2023, 40(5): 681-690. |
| [10] | 董翰林, 王文婷, 谢云, 阿依达娜·叶斯那力, 江源天, 徐嘉淇. 新疆气候干湿变化特征及其影响因素[J]. 干旱区研究, 2023, 40(12): 1875-1884. |
| [11] | 张宗芳, 徐将, 师小军. 新疆野苹果幼苗生长及生物量分配对降水量和降水间隔时间的响应[J]. 干旱区研究, 2023, 40(1): 102-110. |
| [12] | 邬晓丹,罗敏,孟凡浩,萨楚拉,尹超华,包玉海. 气候暖湿化背景下新疆极端气候事件时空演变特征分析[J]. 干旱区研究, 2022, 39(6): 1695-1705. |
| [13] | 蒋磊,赵毅,张鹏伟,何亮,摆翔. 基于氢氧稳定同位素特征的潜水蒸发影响程度研究[J]. 干旱区研究, 2022, 39(6): 1793-1800. |
| [14] | 买买提明·苏来曼,艾拉努尔·卡哈尔,梁灵炜,马木尔别克·马看,王鹏军. 光藓科植物在中国新疆的发现[J]. 干旱区研究, 2022, 39(6): 1852-1855. |
| [15] | 古丽斯旦·艾尼瓦尔,王鹏军,艾拉努尔·卡哈尔,买买提明·苏来曼. 腐木烟杆藓(Buxbaumia viridis)在新疆的新记录及在中国分布的历史更正[J]. 干旱区研究, 2022, 39(6): 1856-1861. |
|
||