干旱区研究 ›› 2021, Vol. 38 ›› Issue (6): 1590-1600.doi: 10.13866/j.azr.2021.06.11
刘璐( ),刘普幸(),张旺雄,司文洋,乔雪梅
收稿日期:2021-01-04
修回日期:2021-03-01
出版日期:2021-11-15
发布日期:2021-11-29
通讯作者:
刘普幸
作者简介:刘璐(1994-),女,硕士研究生,主要研究方向为干旱区域环境与绿洲建设. E-mail: 基金资助:
LIU Lu(),LIU Puxing(),ZHANG Wangxiong,SI Wenyang,QIAO Xuemei
Received:2021-01-04
Revised:2021-03-01
Online:2021-11-15
Published:2021-11-29
Contact:
Puxing LIU
摘要:
研究极端暖事件,对于应对气候变化、制定防灾减灾政策具有重要的理论价值与实际意义。利用1961—2017年中国地面气温日值格点数据集和1961—2050年CMIP6气候模式数据,通过模拟精度验证,筛选出模拟效果较好模式进行多模式集合平均,采用气候倾向率和反距离加权法(IDW)对新疆过去及未来6—9月极端暖事件日数、频率和强度时空变化进行研究。结果表明:过去57 a,新疆极端暖事件日数、频率和强度呈增加趋势,倾向率分别为0.2 d·(10a)-1、0.02次·(10a)-1和0.04 ℃·(10a)-1;极端暖事件日数和频率的空间分布具有南疆高于北疆的特征,高发区为南疆西部,而强度则为北高南低的空间分布特征,高值区分布在北疆。未来33 a,在SSP245与SSP585情景下,新疆极端暖事件日数、频率和强度均呈显著增加趋势;相对于1961—2017年平均极端暖事件日数分别增加21 d和28 d,平均极端暖事件频率分别增加1.6次和1.8次,平均极端暖事件强度分别升高1.2 ℃和1.3 ℃,且SSP585情景下增速更显著;极端暖事件日数和频率高发区位于南疆中部,强度高发区仍在北疆;南疆极端暖事件日数、频率和强度增幅均大于北疆。伊朗副热带高压、西太平洋副热带高压位置的变化与土壤湿度变化会影响新疆极端暖事件的强弱。
刘璐,刘普幸,张旺雄,司文洋,乔雪梅. 1961—2017年新疆极端暖事件变化特征及其未来情景预估[J]. 干旱区研究, 2021, 38(6): 1590-1600.
LIU Lu,LIU Puxing,ZHANG Wangxiong,SI Wenyang,QIAO Xuemei. Variation characteristics of extreme warm events from 1961 to 2017 and projection for future scenarios in Xinjiang, China[J]. Arid Zone Research, 2021, 38(6): 1590-1600.
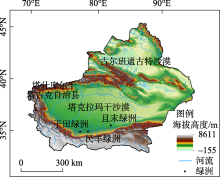
图1
研究区地理位置示意图 注:底图采用自然资源部标准地图制作,审图号:GS(2019)1822,底图无修改。"

表1
14个CMIP6气候模式信息"
| 模式名称 | 机构及所属国家 | 空间分辨率 |
|---|---|---|
| AWI-CM-1-1-MR | AWI,德国 | 0.97°×0.93° |
| BCC-CSM2-MR | BBC,中国 | 1.13°×1.12° |
| CanESM5 | CCCma,加拿大 | 2.81°×2.79° |
| EC-Earth3 | EC-Earth-Cons,欧盟 | 0.7°×0.7° |
| EC-Earth3-Veg | EC-Earth-Cons,欧盟 | 0.7°×0.7° |
| FGOALS-g3 | FGOALS,中国 | 2°×2.03° |
| GFDL-CM4 | NOAA-GFDL,美国 | 1.25°×1° |
| GFDL-ESM4 | NOAA-GFDL,美国 | 1.25°×1° |
| IPSL-CM6A-LR | IPSL,法国 | 2.5°×1.27° |
| INM-CM4-8 | INM,俄罗斯 | 2°×1.5° |
| INM-CM5-0 | INM,俄罗斯 | 2°×1.5° |
| MPI-ESM1-2-LR | MPI-M,德国 | 1.88°×1.87° |
| NESM3 | NUIST,中国 | 1.88°×1.87° |
| NorESM2-LM | NCC,挪威 | 2.5°×1.89° |
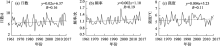
图2
1961—2017年新疆年均极端暖事件的年际变化"
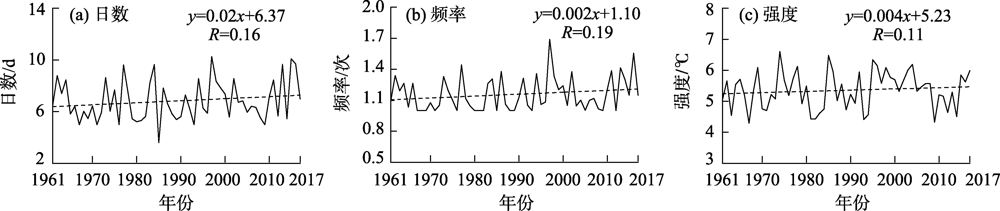
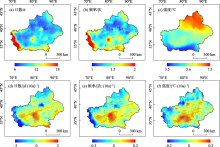
图3
1961—2017年新疆年均极端暖事件空间分布和线性变化趋势 注:蓝色点表示通过0.05信度检验。"

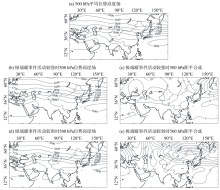
图4
1961—2017年新疆500 hPa位势高度场特征分析"

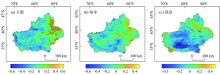
图5
新疆极端暖事件与土壤湿度相关关系 注:黑色点表示通过0.05信度检验。"

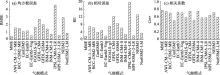
图6
1961—2014年新疆地面气温平均最高温与CMIP6各模式平均最高温的均方根误差、相对误差和相关系数"

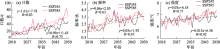
图7
2018—2050年新疆年均极端暖事件的年际变化"
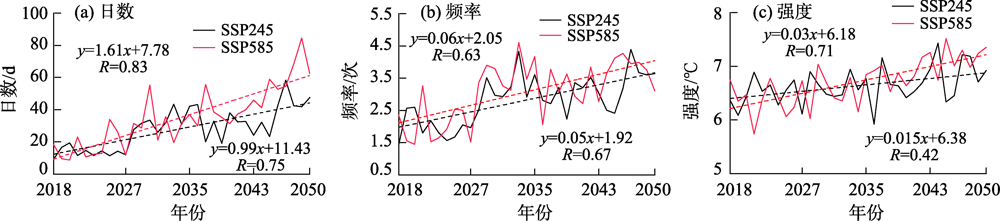
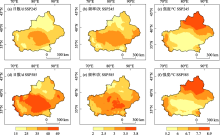
图8
2018—2050年新疆年均极端暖事件空间分布"


图9
2018—2050年新疆极端暖事件变化的空间分布 注:蓝色点表示通过0.05信度检验。"

| [1] |
Easterling D R, Evans J L, Groisman P Y, et al. Observed variability and trends in extreme climate events: A brief review[J]. Bulletin of the American Meteorological Society, 2000, 81(3):417-426.
doi: 10.1175/1520-0477(2000)081<0417:OVATIE>2.3.CO;2 |
| [2] | 任国玉, 封国林, 严中伟. 中国极端气候变化观测研究回顾与展望[J]. 气候与环境研究, 2010, 15(4):337-353. |
| [ Ren Guoyu, Feng Guolin, Yan Zhongwei. Progresses in observation studies of climate extremes and changes in mainland China[J]. Climatic and Environmental Research, 2010, 15(4):337-353. ] | |
| [3] |
Li S, Wei F, Wang Z, et al. Spatial heterogeneity and complexity of the impact of extreme climate on vegetation in China[J]. Sustainability, 2021, 13(10):5748.
doi: 10.3390/su13105748 |
| [4] |
Zhu X, Troy T J. Agriculturally relevant climate extremes and their trends in the world’s major growing regions[J]. Earth’s Future, 2018, 6(4):656-672.
doi: 10.1002/eft2.v6.4 |
| [5] |
Robine J M, Cheung S L K, Roy S L, et al. Death toll exceeded 70000 in Europe during the summer of 2003[J]. Comptes Rendus Biologies, 2008, 331(2):171-178.
doi: 10.1016/j.crvi.2007.12.001 |
| [6] |
Barriopedro D, Fischer E M, Luterbacher J, et al. The hot summer of 2010: Redrawing the temperature record map of Europe[J]. Science, 2011, 332(6026):220-224.
doi: 10.1126/science.1201224 pmid: 21415316 |
| [7] |
Sun Y, Zhang X, Zwiers F W, et al. Rapid increase in the risk of extreme summer heat in Eastern China[J]. Nature Climate Change, 2014, 4(12):1082-1085.
doi: 10.1038/nclimate2410 |
| [8] | 张宇, 张良, 王素萍, 等. 2017年夏季全国干旱状况及其影响与成因[J]. 干旱气象, 2017, 35(5):899-905. |
| [ Zhang Yu, Zhang Liang, Wang Suping, et al. Drought events and its influence in summer of 2017 in China[J]. Journal of Arid Meteorology, 2017, 35(5):899-905. ] | |
| [9] |
Stott P A, Christidis N, Otto F, et al. Attribution of extreme weather and climate-related events[J]. Wiley Interdisciplinary Reviews Climate Change, 2016, 7(1):23-41.
doi: 10.1002/wcc.2016.7.issue-1 |
| [10] |
Seneviratne S I, Donat M G, Mueller B, et al. No pause in the increase of hot temperature extremes[J]. Nature Climate Change, 2014, 4(3):161-163.
doi: 10.1038/nclimate2145 |
| [11] |
Founda D, Papadopoulos K H, Petrakis M, et al. Analysis of mean, maximum and minimum temperature in Athens from 1897-2001 with emphasis on the last decade: Trends, warm events, and cold events[J]. Global and Planetary Change, 2004, 44(1-4):27-38.
doi: 10.1016/j.gloplacha.2004.06.003 |
| [12] |
Founda D. Evolution of the air temperature in Athens and evidence of climatic change: A review[J]. Advances in Building Energy Research, 2011, 5(1):7-41.
doi: 10.1080/17512549.2011.582338 |
| [13] |
Scherrer S C, Fischer E M, Posselt R, et al. Emerging trends in heavy precipitation and hot temperature extremes in Switzerland[J]. Journal of Geophysical Research: Atmospheres, 2016, 121(6):2626-2637.
doi: 10.1002/2015JD024634 |
| [14] |
Founda D, Varotsos K V, Pierros F, et al. Observed and projected shifts in hot extremes’ season in the Eastern Mediterranean[J]. Global and Planetary Change, 2019, 175:190-200.
doi: 10.1016/j.gloplacha.2019.02.012 |
| [15] | Founda D, Pierros F, Petrakis M, et al. Interdecadal variations and trends of the Urban Heat Island in Athens (Greece) and its response to heat waves[J]. Atmospheric Research, 2015, 161:1-13. |
| [16] | 任国玉, 徐铭志, 初子莹, 等. 近54 a中国地面气温变化[J]. 气候与环境研究, 2005, 10(4):717-727. |
| [ Ren Guoyu, Xu Mingzhi, Chu Ziying, et al. Changes of surface air temperature in China during 1951-2004[J]. Climatic and Environmental Research, 2005, 10(4):717-727. ] | |
| [17] | 潘晓华. 近五十年中国极端温度和降水事件变化规律的研究[D]. 北京: 中国气象科学研究院, 2002. |
| [ Pan Xiaohua. Changes in Extreme Temperature Events in China during Recent 50 years[D]. Beijing: Chinese Academy of Meteorological Sciences, 2002. ] | |
| [18] | 齐月, 陈海燕, 房世波, 等. 1961—2010年西北地区极端气候事件变化特征[J]. 干旱气象, 2015, 33(6):963-969. |
| [ Qi Yue, Chen Haiyan, Fang Shibo, et al. Variation characteristics of extreme climate events in Northwest China during 1961-2010[J]. Journal of Arid Meteorology, 2015, 33(6):963-969. ] | |
| [19] |
Pezza A B, Rensch P V, Cai W. Severe heat waves in Southern Australia: Synoptic climatology and large scale connections[J]. Climate Dynamics, 2012, 38(1):209-224.
doi: 10.1007/s00382-011-1016-2 |
| [20] |
Chen X, Zhou T. Relative contributions of external SST forcing and internal atmospheric variability to July-August heat waves over the Yangtze River valley[J]. Climate Dynamics, 2018, 51(11):4403-4419.
doi: 10.1007/s00382-017-3871-y |
| [21] | 陈海山, 周晶. 土壤湿度年际变化对中国区域极端气候事件模拟的影响研究Ⅱ.敏感性试验分析[J]. 大气科学, 2013, 37(1):1-13. |
| [ Chen Haishan, Zhou Jing. Impact of interannual soil moisture anomaly on simulation of extreme climate events in China. Part II: Sensitivity experiment analysis[J]. Chinese Journal of Atmospheric Sciences, 2013, 37(1):1-13. ] | |
| [22] |
Della-Marta P M, Luterbacher J, Weissenfluh H V, et al. Summer heat waves over Western Europe 1880-2003, their relationship to large-scale forcings and predictability[J]. Climate Dynamics, 2007, 29(2):251-275.
doi: 10.1007/s00382-007-0233-1 |
| [23] |
Wu Z, Lin H, Li J, et al. Heat wave frequency variability over North America: Two distinct leading modes[J]. Journal of Geophysical Research: Atmospheres, 2012, 117:D02102. doi: 10.1029/2011JD016908.
doi: 10.1029/2011JD016908 |
| [24] | 李艳, 马百胜, 杨宣, 等. 中国大陆夏季高温热浪事件的特征及两类El Niño事件对其影响[J]. 兰州大学学报(自然科学版), 2018, 54(6):711-720. |
| [ Li Yan, Ma Baisheng, Yang Xuan, et al. Characteristics of summer heat waves in China Mainland and the relationship between Eastern-/Central-Pacific El Niño and heat wave events[J]. Journal of Lanzhou University (Natural Sciences), 2018, 54(6):711-720. ] | |
| [25] |
Freychet N, Tett S, Wang J, et al. Summer heat waves over Eastern China: Dynamical processes and trend attribution[J]. Environmental Research Letters, 2017, 12(2):024015.
doi: 10.1088/1748-9326/aa5ba3 |
| [26] | 张杰. 新疆区域气候变化评估报告决策者摘要及执行摘要[M]. 北京: 气象出版社, 2013. |
| [ Zhang Jie. Xinjiang Regional Climate Change Assessment Report Summary for Policymakers and Executive Summary[M]. Beijing: China Meteorological Press, 2013. ] | |
| [27] | 毛炜峄, 陈鹏翔, 沈永平. 气候变暖背景下2015年夏季新疆极端高温过程及其影响[J]. 冰川冻土, 2016, 38(2):291-304. |
| [ Mao Weiyi, Chen Pengxiang, Shen Yongping. Characteristics and effects of the extreme maximum air temperature in the summer of 2015 in Xinjiang under global warming[J]. Journal of Glaciology and Geocryology, 2016, 38(2):291-304. ] | |
| [28] | 张丽霞, 陈晓龙, 辛晓歌. CMIP6情景模式比较计划(ScenarioMIP)概况与评述[J]. 气候变化研究进展, 2019, 15(5):519-525. |
| [ Zhang Lixia, Chen Xiaolong, Xin Xiaoge. Short commentary on CMIP6 Scenario Model Intercomparison Project (ScenarioMIP)[J]. Climate Change Research, 2019, 15(5):519-525. ] | |
| [29] | 殷田园, 殷淑燕, 李富民. 秦岭南北区域夏季极端降水与西太平洋副热带高压的关系[J]. 干旱区研究, 2019, 36(6):1379-1390. |
| [ Yin Tianyuan, Yin Shuyan, Li Fumin. Relationship between the summer extreme precipitation in the south and north of the Qinling Mountains and the Western Pacific Subtropical High[J]. Arid Zone Research, 2019, 36(6):1379-1390. ] | |
| [30] | 李娇, 任国玉, 战云健. 浅谈极端气温事件研究中阈值确定方法[J]. 气象科技进展, 2013, 3(5):36-40. |
| [ Li Jiao, Ren Guoyu, Zhan Yunjian. Discussion on threshold determination in defining extreme temperature indices[J]. Advances in Meteorological Science and Technology, 2013, 3(5):36-40. ] | |
| [31] |
Hobday A J, Alexander L V, Perkins S E, et al. A hierarchical approach to defining marine heatwaves[J]. Progress in Oceanography, 2016, 141(14):227-238.
doi: 10.1016/j.pocean.2015.12.014 |
| [32] | 丁一汇. “暖冬”渐行渐远全球变暖暂时停滞了吗?[J]. 今日科苑, 2011, 15(24):19-22. |
| [ Ding Yihui. The warm winter is fading away is global warming temporarily stagnant?[J] Modern Science, 2011, 15(24):19-22. ] | |
| [33] | 孔锋. 1961—2018年中国极端冷暖事件变化及其空间差异特征[J]. 水利水电技术, 2020, 51(9):34-44. |
| [ Kong Feng. The change of extreme cold and warm events in China from 1961 to 2018 and their spatial differences[J]. Water Resources and Hydropower Engineering, 2020, 51(9):34-44. ] | |
| [34] | 邵勰, 廖要明, 柳艳菊, 等. 2015年全球重大天气气候事件及其成因[J]. 气象, 2016, 42(4):489-495. |
| [ Shao Xie, Liao Yaoming, Liu Yanju, et al. Global major weather and climate events in 2015 and possible cause[J]. Meteorological Monthly, 2016, 42(4):489-495. ] | |
| [35] | 陈颖, 邵伟玲, 曹萌, 等. 新疆夏季高温日数的变化特征及其影响因子[J]. 干旱区研究, 2020, 37(1):58-66. |
| [ Chen Ying, Shao Weiling, Cao Meng, et al. Variation of summer high temperature days and its affecting factors in Xinjiang[J]. Arid Zone Research, 2020, 37(1):58-66. ] | |
| [36] | 孙颖, 丁一汇. IPCC AR4气候模式对东亚夏季风年代际变化的模拟性能评估[J]. 气象学报, 2008, 66(5):765-780. |
| [ Sun Ying, Ding Yihui. Validation of IPCC AR4 climate models in simulating interdecadal change of East Asian summer monsoon[J]. Acta Meteorologica Sinica, 2008, 66(5):765-780. ] | |
| [37] | 张明. 基于多指标、多尺度的中国极端高温事件时空分析[D]. 上海: 上海师范大学, 2016. |
| [ Zhang Ming. A Multi-scale Spatiotemporal Analysis of Extreme High Temperature Events in China Based on Multiple Indices[D]. Shanghai: Shanghai Normal University, 2016. ] | |
| [38] |
Robinson S A, Klekociuk A R, King D H, et al. The 2019/2020 summer of Antarctic heatwaves[J]. Global Chang Biology, 2020, 26(6):3178-3180.
doi: 10.1111/gcb.v26.6 |
| [39] |
Dobricic S, Russo S, Pozzoli L, et al. Increasing occurrence of heat waves in the terrestrial Arctic[J]. Environmental Research Letters, 2020, 15(2):024022.
doi: 10.1088/1748-9326/ab6398 |
| [40] |
Guo X, Huang J, Luo Y, et al. Projection of heat waves over China for eight different global warming targets using 12 CMIP5 models[J]. Theoretical and Applied Climatology, 2017, 128(3-4):507-522.
doi: 10.1007/s00704-015-1718-1 |
| [41] | 王冀, 江志红, 丁裕国, 等. 21世纪中国极端气温指数变化情况预估[J]. 资源科学, 2008, 30(7):1084-1092. |
| [ Wang Ji, Jiang Zhihong, Ding Yuguo, et al. Multi-model ensemble prediction of extreme temperature indices in China[J]. Resources Science, 2008, 30(7):1084-1092. ] |
| [1] | 李小锋, 惠婷婷, 李耀明, 毛洁菲, 王光宇, 范连连. 不同放牧管理方式对新疆山地草原植物群落特征的影响[J]. 干旱区研究, 2024, 41(1): 124-134. |
| [2] | 刘一丹, 姚晓军, 李宗省, 胡家瑜. 气候变化和土地利用覆盖变化对河西地区植被净初级生产力的影响[J]. 干旱区研究, 2024, 41(1): 169-180. |
| [3] | 汪翔, 吕海深, 朱永华, 郭晨煜. 两种河道洪水演进方法在新疆山区的应用比较[J]. 干旱区研究, 2023, 40(8): 1240-1247. |
| [4] | 王超, 马占仓, 潘成南, 吴星月, 宋文丹, 阎平. 新疆苋属新记录植物[J]. 干旱区研究, 2023, 40(8): 1280-1288. |
| [5] | 古丽斯旦·艾尼瓦尔, 吐尔洪·努尔东, 地力胡马尔·阿不都克热木, 买买提明·苏来曼. 新疆薄罗藓科植物新记录[J]. 干旱区研究, 2023, 40(8): 1289-1293. |
| [6] | 文妙霞, 何学高, 刘欢, 张婧, 罗晨, 贾丰铭, 王义贵, 胡云云. 基于地理探测器的宁夏草地植被覆被时空分异及驱动因子[J]. 干旱区研究, 2023, 40(8): 1322-1332. |
| [7] | 李虹, 李忠勤, 陈普晨, 彭加加. 近20 a新疆阿尔泰山积雪时空变化及其影响因素[J]. 干旱区研究, 2023, 40(7): 1040-1051. |
| [8] | 王士维, 孙栋元, 周敏, 王亦可, 王祥镔, 季宗虎, 张文睿, 武兰珍. 1951—2020年疏勒河流域气温时空变化特征[J]. 干旱区研究, 2023, 40(7): 1065-1074. |
| [9] | 赵卓怡, 郝兴明. 基于Priestley-Taylor方法的中亚干旱区实际蒸散特征及归因[J]. 干旱区研究, 2023, 40(7): 1085-1093. |
| [10] | 许君利, 韩海东, 王建. 新疆大气PM2.5来源与潜在贡献源分析[J]. 干旱区研究, 2023, 40(6): 874-884. |
| [11] | 薛一波, 张小啸, 雷加强, 李生宇, 王永东, 尤源. 北非埃及地区风蚀沙尘时空变化研究[J]. 干旱区研究, 2023, 40(6): 896-904. |
| [12] | 薛一波, 黄双燕, 张小啸, 雷加强, 李生宇. 新疆2018年冬季雨雪风沙强降尘事件[J]. 干旱区研究, 2023, 40(5): 681-690. |
| [13] | 赵克明, 孙鸣婧, 李霞, 施俊杰, 安大维, 许婷婷. 两种典型大气扩散指数在新疆的分布特征及其适用性对比[J]. 干旱区研究, 2023, 40(5): 691-702. |
| [14] | 任丽雯, 王兴涛, 刘明春, 王大为. 石羊河流域植被净初级生产力时空变化及驱动因素[J]. 干旱区研究, 2023, 40(5): 818-828. |
| [15] | 李鑫磊, 李瑞平, 王秀青, 王思楠, 王成坤. 基于地理探测器的河套灌区林草植被覆盖度时空变化与驱动力分析[J]. 干旱区研究, 2023, 40(4): 623-635. |
|
||