Arid Zone Research ›› 2023, Vol. 40 ›› Issue (11): 1865-1874.doi: 10.13866/j.azr.2023.11.16
• Agricultural Ecology • Previous Articles
Areziguli ROZI1,2,3( ),Mamat SAWUT1,2,3(),HE Xugang1,2,3,YE Xiaowen1,2,3
Received:2023-05-11
Revised:2023-07-20
Online:2023-11-15
Published:2023-12-01
Areziguli ROZI, Mamat SAWUT, HE Xugang, YE Xiaowen. Estimation of cotton leaf chlorophyll content based on combinations of multi-vegetation indices[J].Arid Zone Research, 2023, 40(11): 1865-1874.
Add to citation manager EndNote|Reference Manager|ProCite|BibTeX|RefWorks
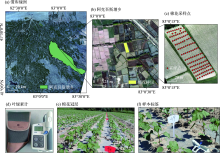
Fig. 1
Schematic diagram of the distribution of the study area and sample points"

Tab. 1
Previously published hyperspectral vegetation indices"
| 植被指数 | 计算公式 | 文献 | 植被指数 | 计算公式 | 文献 |
|---|---|---|---|---|---|
| GNDVI | [ | NRI | [ | ||
| PSRI | [ | NPCI | [ | ||
| VARI | [ | RVI | [ | ||
| NDVI | [ | DVI | [ | ||
| VOG1 | [ | VOG2 | [ | ||
| G | [ | Lichtenthaler1 | [ | ||
| Lichtenthaler2 | [ | SIPI | [ | ||
| PSSRa | [ | Vogelmann1 | [ | ||
| Vogelmann3 | [ | ND | [ | ||
| CIred edge | [ | CIgreen | [ | ||
| RI-half | [ | GRVI | [ | ||
| RDVI | [ | Datt1 | [ | ||
| Datt2 | [ | Datt3 | [ | ||
| Carte1 | [ | Carte2 | [ | ||
| Carte3 | [ | Carte4 | [ | ||
| SR[752,690] | [ | SR[675,700] | [ | ||
| NVI | [ | MSR705 | [ | ||
| SAVI | [ | ||||
| GARI | [ | ||||
| OSAVI | [ | ||||
| RO | 红谷(640~680 nm)内反射率最小值 | [ | |||
| mND705 | [ | ||||
| EVI | [ | ||||
| MCARI | [ | ||||
| TVI | [ | ||||
| MTVI1 | [ | ||||
| REP | [ | ||||
| SPVI | [ | ||||
| SPVI2 | [ | ||||
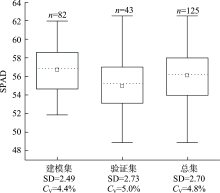
Fig. 2
Statistics on chlorophyll content in cotton leaves"

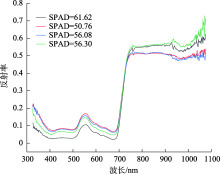
Fig. 3
Change in spectral reflectance under different chlorophyll content"

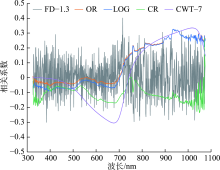
Fig. 4
Correlation analysis of reflectance and chlorophyll content in different mathematical transformations"
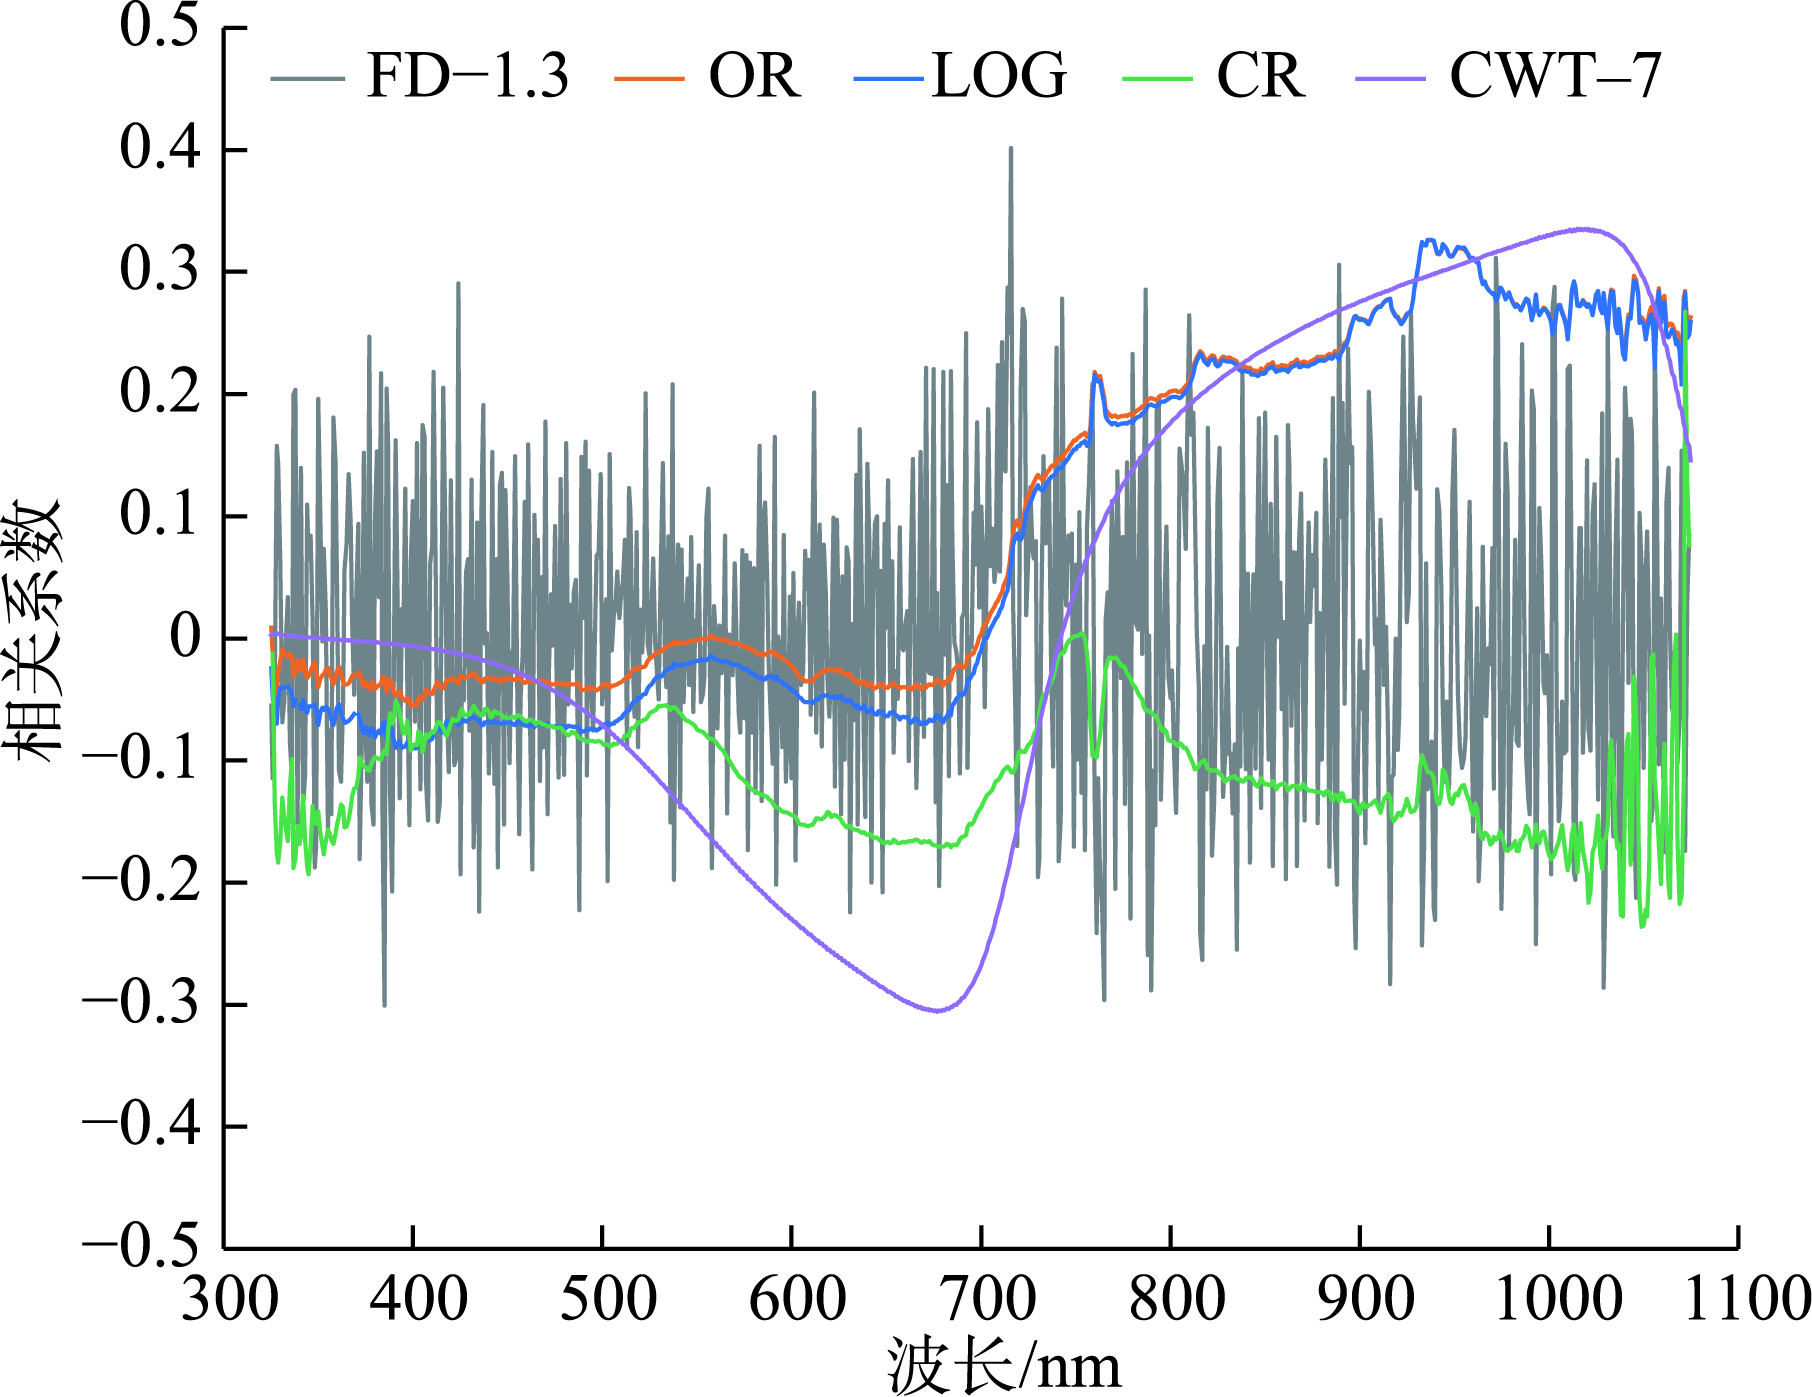
Fig. 5
Vegetation index combination under different mathematical transformations"

Tab. 2
Correlation analysis of chlorophyll content and vegetation index under different spectral transformations of cotton leaves"
| 光谱变换 | 植被指数 | 相关性范围 |
|---|---|---|
| OR | SAVI,DVI,ND,RDVI,SPVI,SPVI2 | 0.24~0.26 |
| LogR | VOG1,NDCI,Datt2,ND,RVI,NDVI,GNDVI,PSSRa,CIgreen,carte3 | -0.27~-0.37 |
| FD-0.3 | SAVI,OSARI,DVI,ND,RDVI,Carte3,Carte4,Carte2,SPVI,SPVI2 | -0.28~0.29 |
| FD-0.6 | DVI,SPVI2,SAVI,OSARI,EVI,ND,RDVI,Carte2,Carte4,VOG2 | -0.33~0.34 |
| FD-0.9 | Vogelmann3,RVI,DVI,SR[675-700],Mndvi705,ND,VOG1,NVI,TVI,VOG2 | -0.23~0.30 |
| CWT-3 | CIred,PSSRa,MSR705,RVI,Lichtenthaler2,VOG1,SIPI,CIgreen,GNDVI,SPVI | -0.27~0.28 |
| CWT-7 | REP,MCARI,Vogelmann1,Datt1,GRVI,MTVI1,carte1,Ro,G,NRI | -0.31~0.34 |
Tab. 3
Comparison of model modeling results"
| 光谱变换 | 模型算法 | 建模集 | 验证集 | |||||
|---|---|---|---|---|---|---|---|---|
| R2 | RMSE | MRE | R2 | RMSE | MRE | |||
| OR | WOA-RFR | 0.889 | 0.014 | 0.015 | 0.918 | 0.050 | 0.015 | |
| RFR | 0.860 | 1.307 | 0.019 | 0.862 | 1.240 | 0.018 | ||
| SVR | 0.756 | 1.241 | 0.013 | 0.908 | 0.854 | 0.006 | ||
| LogR | WOA-RFR | 0.912 | 1.067 | 0.016 | 0.894 | 1.081 | 0.015 | |
| RFR | 0.884 | 1.367 | 0.020 | 0.858 | 1.280 | 0.020 | ||
| SVR | 0.658 | 1.460 | 0.015 | 0.943 | 0.651 | 0.006 | ||
| FD-0.3 | WOA-RFR | 0.917 | 1.019 | 0.014 | 0.878 | 1.060 | 0.016 | |
| RFR | 0.872 | 1.357 | 0.020 | 0.850 | 1.269 | 0.019 | ||
| SVR | 0.609 | 1.569 | 0.017 | 0.866 | 1.035 | 0.010 | ||
| FD-0.6 | WOA-RFR | 0.890 | 1.085 | 0.015 | 0.925 | 1.008 | 0.014 | |
| RFR | 0.872 | 1.379 | 0.019 | 0.846 | 1.388 | 0.021 | ||
| SVR | 0.451 | 1.836 | 0.020 | 0.685 | 1.594 | 0.018 | ||
| FD-0.9 | WOA-RFR | 0.920 | 0.987 | 0.013 | 0.955 | 0.986 | 0.014 | |
| RFR | 0.916 | 1.250 | 0.018 | 0.949 | 1.207 | 0.017 | ||
| SVR | 0.754 | 1.263 | 0.013 | 0.882 | 0.973 | 0.010 | ||
| CWT-3 | WOA-RFR | 0.895 | 1.091 | 0.015 | 0.922 | 1.086 | 0.014 | |
| RFR | 0.892 | 1.388 | 0.020 | 0.900 | 1.443 | 0.020 | ||
| SVR | 0.779 | 1.172 | 0.010 | 0.906 | 0.835 | 0.007 | ||
| CWT-7 | WOA-RFR | 0.934 | 0.946 | 0.013 | 0.911 | 1.082 | 0.015 | |
| RFR | 0.913 | 1.286 | 0.019 | 0.841 | 1.281 | 0.020 | ||
| SVR | 0.522 | 1.724 | 0.019 | 0.791 | 1.254 | 0.009 | ||

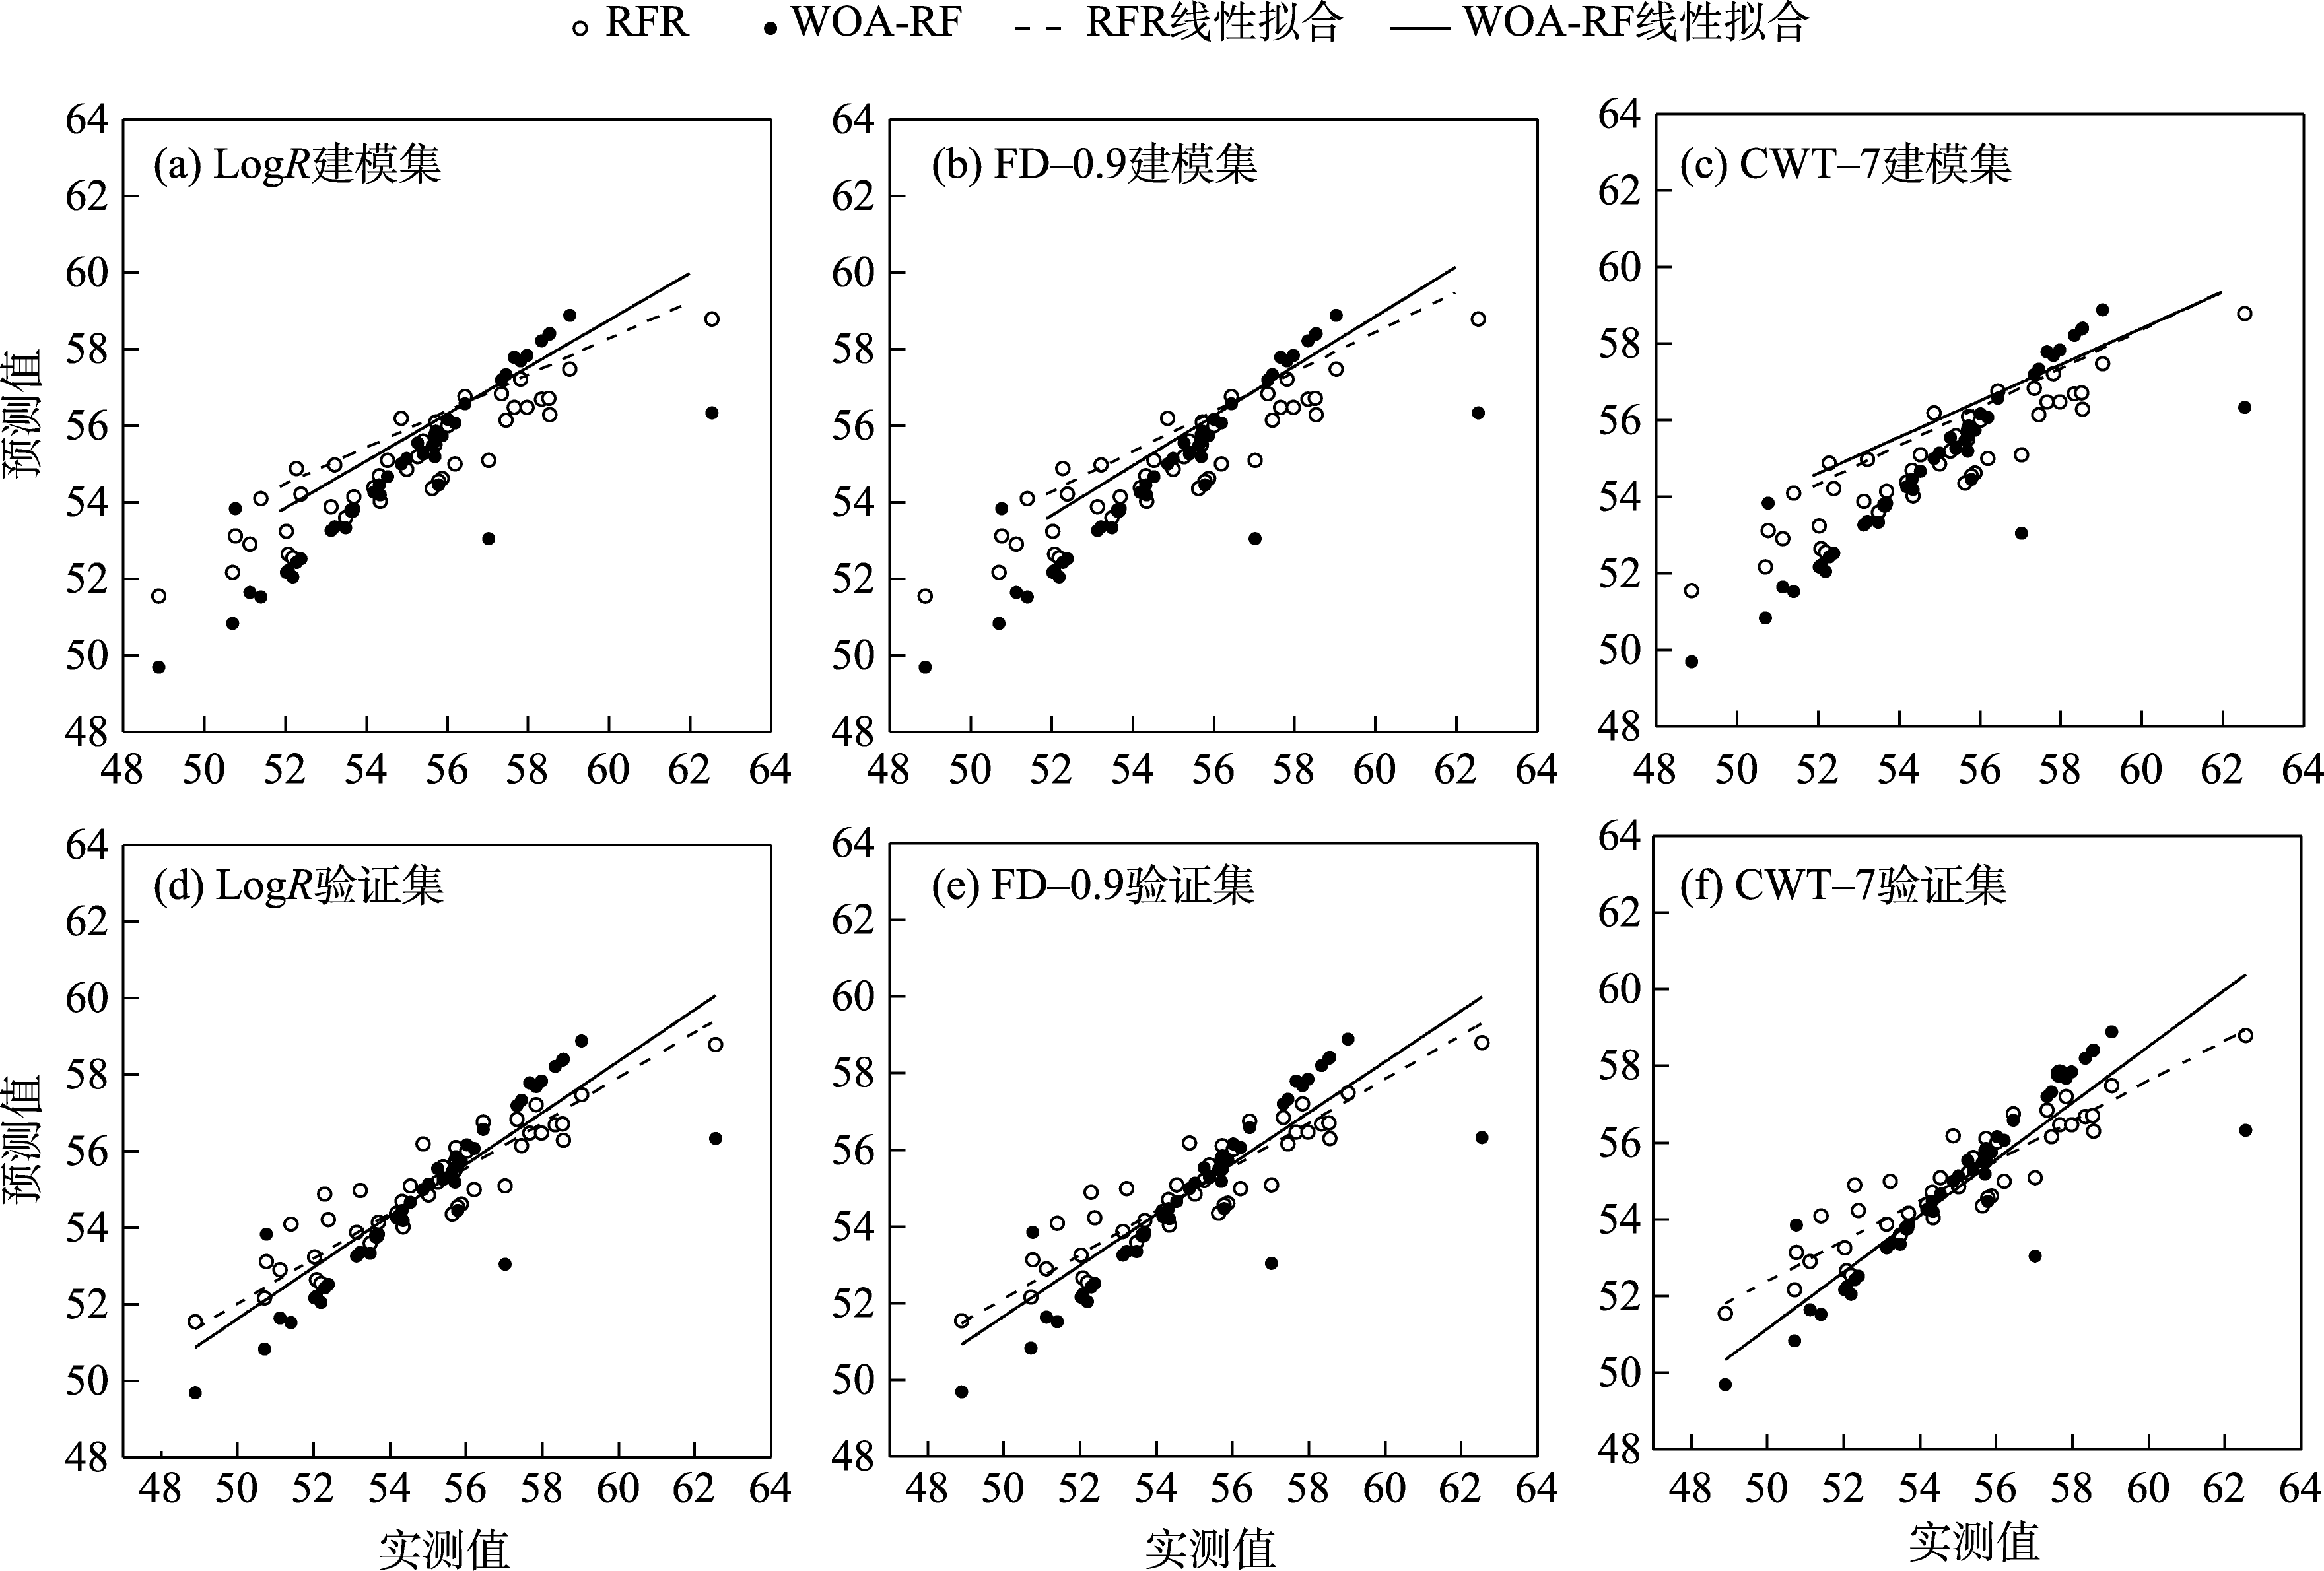
Fig. 6
Scatter plots of measured and predicted value"
| [1] |
依尔夏提·阿不来提, 买买提·沙吾提, 白灯莎·买买提艾力, 等. 基于随机森林法的棉花叶片叶绿素含量估算[J]. 作物学报, 2019, 45(1): 81-90.
doi: 10.3724/SP.J.1006.2019.84058 |
|
[Ershat Ablet, Mamat Sawut, Baidengsha Maimaitiaili, et al. Estimation of leaf chlorophyll content in cotton based on the random forest approach[J]. Acta Agronomica Sinica, 2019, 45(1): 81-90.]
doi: 10.3724/SP.J.1006.2019.84058 |
|
| [2] | 王伟东, 常庆瑞, 王玉娜. 基于UHD185成像光谱仪的冬小麦叶绿素监测[J]. 干旱区研究, 2020, 37(5): 1362-1369. |
| [Wang Weidong, Chang Qingrui, Wang Yuna. SPAD monitoring of winter wheat based on a UHD185 imaging spectrometer[J]. Arid Zone Research, 2020, 37(5): 1362-1369.] | |
| [3] | Xiao Q L, Tang W T, Zhang C, et al. Spectral preprocessing combined with deep transfer learning to evaluate chlorophyll content in cotton leaves[J]. Plant Phenomics, 2022, 2022: 9813841. |
| [4] | 安赛日丁·艾尔肯, 买买提·沙吾提, 李金朝. 基于冠层光谱特征的长绒棉叶绿素含量估算[J]. 激光与光电子学进展, 2022, 59(5):1-11. |
| [Arkin Ansardin, Sawut Mamat, Li Jinzhao. Estimation of chlorophyll content of long-staple cotton based on canopy spectrum characteristics[J]. Laser & Optoelectronics Progress, 2022, 59(5):1-11. ] | |
| [5] |
Liu N, Xing Z P, Zhao R M, et al. Analysis of chlorophyll concentration in potato crop by coupling continuous wavelet transform and spectral variable optimization[J]. Remote Sensing, 2020, 12(17): 2826.
doi: 10.3390/rs12172826 |
| [6] | 茹克亚·萨吾提, 阿不都艾尼·阿不里, 尼加提·卡斯木, 等. 基于分数阶微分的春小麦叶绿素含量高光谱估算[J]. 麦类作物学报, 2019, 39(6): 738-746. |
| [Rukeya Sawuti, Abuaini Abula, Nijati Kasimu, et al. Spectral estimation of chlorophyll content in spring wheat leaves based on fractional differential[J]. Journal of Triticeae Crops, 2019, 39(6): 738-746.] | |
| [7] | 张思楠, 王权, 靳佳, 等. 应用光谱指数法估算多枝柽柳同化枝叶绿素含量[J]. 干旱区研究, 2016, 33(5): 1088-1097. |
| [Zhang Sinan, Wang Quan, Jin Jia, et al. Application of hyperspectral indices for estimating leaf chlorophyll content of assimilating shoots of Tamarix Ramosissima[J]. Arid Zone Research, 2016, 33(5): 1088-1097.] | |
| [8] | 李长春, 施锦锦, 马春艳, 等. 基于小波变换和分数阶微分的冬小麦叶绿素含量估算[J]. 农业机械学报, 2021, 52(8): 172-182. |
| [Li Changchun, Shi Jinjin, Ma Chunyan, et al. Estimation of chlorophyll content in winter wheat based on wavelet transform and fractional differential[J]. Transactions of the Chinese Society for Agricultural Machinery, 2021, 52(8): 172-182.] | |
| [9] |
Verma B, Prasad R, Srivastava P, et al. Investigation of optimal vegetation indices for retrieval of leaf chlorophyll and leaf area index using enhanced learning algorithms[J]. Computers and Electronics in Agriculture, 2022, 192: 106581.
doi: 10.1016/j.compag.2021.106581 |
| [10] |
Wu C Y, Zheng N, Tang Q, et al. Estimating chlorophyll content from hyperspectral vegetation indices: Modeling and validation[J]. Agricultural and Forest Meteorology, 2008, 148(8-9): 1230-1241.
doi: 10.1016/j.agrformet.2008.03.005 |
| [11] | 张卓然. 棉花高光谱特征及其农学参数遥感反演研究[D]. 杨凌: 西北农林科技大学, 2018. |
| [Zhang Zhuoran. Research on Hyperspectral Characteristic of Cotton and Remote Sensing Inversion about Cotton Agronomic Parameters[D]. Yangling: Northwest A&F University, 2018.] | |
| [12] |
Liu N F, Townsend P A, Naber M R, et al. Hyperspectral imagery to monitor crop nutrient status within and across growing seasons[J]. Remote Sensing of Environment, 2021, 255: 112303.
doi: 10.1016/j.rse.2021.112303 |
| [13] |
Sun Q, Jiao Q J, Chen X D, et al. Machine learning algorithms for the retrieval of canopy chlorophyll content and leaf area index of crops using the PROSAIL-D model with the adjusted average leaf angle[J]. Remote Sensing, 2023, 15(9): 2264.
doi: 10.3390/rs15092264 |
| [14] | 郭超凡, 陈雯璟, 牛明艳, 等. 基于多植被指数模型的草地地上生物量协同估算[J]. 干旱地区农业研究, 2022, 40(4): 206-213. |
| [Guo Chaofan, Chen Wenjing, Niu Mingyan, et al. Collaborative estimation of aboveground biomass in grassland based on multiple vegetation index models[J]. Agricultural Research in the Arid Areas, 2022, 40(4): 206-213.] | |
| [15] |
Qi H X, Zhu B Y, Kong L X, et al. Hyperspectral inversion model of chlorophyll content in peanut leaves[J]. Applied Sciences, 2020, 10(7): 2259.
doi: 10.3390/app10072259 |
| [16] | 玉苏甫·买买提, 吐尔逊·艾山, 买合皮热提·吾拉木. 新疆渭-库绿洲棉花种植面积遥感监测研究[J]. 农业现代化研究, 2014, 35(2): 240-243. |
| [Yusup Mamat, Tursun Hasan, Magpirat Gulam. Remote sensing of cotton plantation areas monitoring in delta oasis of Ugan-Kucha River, Xinjiang[J]. Research of Agricultural Modernization, 2014, 35(2): 240-243.] | |
| [17] | 刘楠, 杨海波, 高飞, 等. 基于查找表法和优化光谱指数的马铃薯叶绿素反演[J]. 中国马铃薯, 2022, 36(6): 495-507. |
| [Liu Nan, Yang Haibo, Gao Fei, et al. Potato chlorophyll inversion based on LUT and optimized spectral index[J]. Chinese Potato Journal, 2022, 36(6): 495-507.] | |
| [18] | 许童羽, 邢思敏, 于丰华, 等. 基于多植被指数组合的BAS-ELM粳稻冠层氮含量反演方法[J]. 沈阳农业大学学报, 2021, 52(5): 577-585. |
| [Xu Tongyu, Xing Simin, Yu Fenghua, et al. A BAS-ELM inversion method of Japonica rice canopy nitrogen content based on A combination of multiple vegetation indices[J]. Journal of Shenyang Agricultural University, 2021, 52(5): 577-585.] | |
| [19] | 陈圣波, 陈彦冰, 任枫荻, 等. 基于光谱指数的玉米叶绿素含量估算[J]. 信阳师范学院学报(自然科学版), 2021, 34(2): 225-229. |
| [Chen Shengbo, Chen Yanbing, Ren Fengdi, et al. Estimation of maize chlorophyll content based on spectral index[J]. Journal of Xinyang Normal University(Natural Science Edition), 2021, 34(2): 225-229.] | |
| [20] |
傅坤亚, 张文宇, 曹宏鑫, 等. 基于光谱的作物病虫害监测研究进展[J]. 中国农业科技导报, 2014, 16(5): 90-98.
doi: 10.13304/j.nykjdb.2014.018 |
|
[Fu Kunya, Zhang Wenyu, Cao Hongxin, et al. Research progress on crop diseases and insect pests monitoring based on spectrum[J]. Journal of Agricultural Science and Technology, 2014, 16(5): 90-98.]
doi: 10.13304/j.nykjdb.2014.018 |
|
| [21] | 王芳东, 严志雁, 赵小敏, 等. 油茶叶片叶绿素含量高光谱估测的偏最小二乘模型参数选择[J]. 江西农业大学学报, 2022, 44(1): 86-96. |
| [Wang Fangdong, Yan Zhiyan, Zhao Xiaomin, et al. Parameter selection of partial least squares model for hyperspectral estimation of chlorophyll content in camellia oleifera leaves[J]. Acta Agriculturae Universitatis Jiangxiensis, 2022, 44(1): 86-96.] | |
| [22] | 王鑫梅, 张劲松, 孟平, 等. 基于无人机遥感影像的核桃冠层氮素含量估算[J]. 农业机械学报, 2021, 52(2): 178-187. |
| [Wang Xinmei, Zhang Jinsong, Meng Ping, et al. Estimation of nitrogen content in walnut canopy based on UAV remote sensing image[J]. Transactions of the Chinese Society for Agricultural Machinery, 2021, 52(2): 178-187.] | |
| [23] |
孙林, 程丽娟. 植被叶片生化组分的光谱响应特征分析[J]. 光谱学与光谱分析, 2010, 30(11): 3031-3035.
pmid: 21284178 |
|
[Sun Lin, Cheng Lijuan. Analysis of spectral response of vegetation leaf biochemical components[J]. Spectroscopy and Spectral Analysis, 2010, 30(11): 3031-3035.]
pmid: 21284178 |
|
| [24] | 洪帅, 张泽, 张立福, 等. 滴灌棉花不同生育时期冠层叶片叶绿素含量的高光谱估测模型[J]. 棉花学报, 2019, 31(2): 138-146. |
| [Hong Shuai, Zhang Ze, Zhang Lifu, et al. Hyperspectral estimation model of chlorophyll content in cotton canopy leaves under drip irrigation at different growth stages[J]. Cotton Science, 2019, 31(2): 138-146.] | |
| [25] |
Liang L, Di L P, Zhang L P, et al. Estimation of crop LAI using hyperspectral vegetation indices and a hybrid inversion method[J]. Remote Sensing of Environment, 2015, 165: 123-134.
doi: 10.1016/j.rse.2015.04.032 |
| [26] |
Mirjalili S, Lewis A. The whale optimization algorithm[J]. Advances in Engineering Software, 2016, 95: 51-67.
doi: 10.1016/j.advengsoft.2016.01.008 |
| [27] |
童新, 杨震雷, 张亦然, 等. 基于不同阶微分高光谱植被指数的牧区草场地上生物量估算[J]. 草地学报, 2022, 30(9): 2438-2448.
doi: 10.11733/j.issn.1007-0435.2022.09.025 |
|
[Tong Xin, Yang Zhenglei, Zhang Yiran, et al. Estimation of pasture aboveground biomass using different orders of differential hyperspectral vegetation indices[J]. Acta Agrestia Sinica, 2022, 30(9): 2438-2448.]
doi: 10.11733/j.issn.1007-0435.2022.09.025 |
|
| [28] | 李莉婕, 岳延滨, 王延仓, 等. 高光谱定量反演火龙果茎枝叶绿素含量的研究[J]. 光谱学与光谱分析, 2021, 41(11): 3538-3544. |
| [Li Lijie, Yue Yanbin, Wang Yancang, et al. The quantitative study on chlorophyll content of Hylocereus Polyrhizus based on hyperspectral analysis[J]. Spectroscopy and Spectral Analysis, 2021, 41(11): 3538-3544.] | |
| [29] | 竞霞, 张腾, 邹琴, 等. 基于分数阶微分光谱指数的小麦条锈病遥感监测模型构建[J]. 农业工程学报, 2021, 37(17): 142-151. |
| [Jing Xia, Zhang Teng, Zou Qin, et al. Construction of remote sensing monitoring model of wheat stripe rust based on fractional-order differential spectral index[J]. Transactions of the Chinese Society of Agricultural Engineering, 2021, 37(17): 142-151.] | |
| [30] |
Wu C Y, Niu Z, Tang Q, et al. Estimating chlorophyll content from hyperspectral vegetation indices: Modeling and validation[J]. Agricultural and Forest Meteorology, 2008, 148(8): 1230-1241.
doi: 10.1016/j.agrformet.2008.03.005 |
| [1] | ZHANG Ziqi, YANG Lili, HE Xinlin, LI Xiaolong. Effects of the regulation of water-salt-nitrogen on water-salt nutrient transport and yield in drip-irrigated cotton fields [J]. Arid Zone Research, 2024, 41(5): 876-893. |
| [2] | LAI Hongyu, LYU Desheng, ZHU Yan, WANG Zhenhua, WEN Yue, SONG Libing, QI Hao. Effects of biochar application on soil hydrothermal salinity and cotton growth in brackish water drip irrigation cotton field [J]. Arid Zone Research, 2024, 41(2): 326-338. |
| [3] | LIU Yanxue, QIAO Changlu. Study on evapotranspiration of cotton field under drip irrigation in oasis of arid region [J]. Arid Zone Research, 2023, 40(1): 152-162. |
| [4] | GUO Xiaowen,LIU Jiawei,ZHENG Zhiyu,MIN Wei. Effects of saline water drip irrigation on soil salt accumulation and cotton growth during the whole growth period [J]. Arid Zone Research, 2022, 39(6): 1952-1965. |
| [5] | ZHANG Hui,ZHANG Kai,CHEN Bing,YANG Chuan,LIU Ping. Effects of different irrigation rates on cotton growth and yield formation in Xinjiang [J]. Arid Zone Research, 2022, 39(6): 1976-1985. |
| [6] | WANG Jiawen,PENG Jie,JI Wenjun,BAI Jianduo,FENG Chunhui,LI Hongyi. Soil pH inversion based on electromagnetic induction data in cotton field of southern Xinjiang [J]. Arid Zone Research, 2022, 39(4): 1293-1302. |
| [7] | DAI Jianmin,HE Qingyu,XIE Ling,DOU Qiaoqiao,ZHANG Jusong. Compensation effect of nitrogen fertilizer post-shift on water-deficient cotton yield at different stages [J]. Arid Zone Research, 2022, 39(3): 986-995. |
| [8] | TAN Mingdong,WANG Zhenhua,WANG Yue,LI Wenhao,ZONG Rui,ZOU Jie. Soil salt accumulation characteristics of long-term drip irrigation in cotton fields during non-irrigation seasons [J]. Arid Zone Research, 2022, 39(2): 485-492. |
| [9] | WANG Xuyang,LI Dianpeng,SUN Tao,SUN Xia,JIA Hongtao,LI Jun,LI Xinhu. Effects of soil mulching on the greenhouse gas emissions of crops farmland in an arid area of Xinjiang [J]. Arid Zone Research, 2022, 39(1): 176-184. |
| [10] | WANG Dongwang,WANG Zhenhua,CHEN Lin,LI Wenhao. Effect of drip irrigation under mulch combined with drainage by concealed pipes on soil leaching in Xinjiang [J]. Arid Zone Research, 2021, 38(4): 1010-1019. |
| [11] | ZHU Jinru,LI Wenhao,WANG Zhenhua,ZONG Rui,WANG Tianyu. Effect of film mulching residue on cotton growth in drip irrigation cotton field [J]. Arid Zone Research, 2021, 38(2): 570-579. |
| [12] | WANG Zhenlin,LYU Zhaozhi,ZHANG Xin,LIU Yongjian. Analysis on risk assessment of Bt cotton planting in Xinjiang [J]. Arid Zone Research, 2021, 38(2): 580-588. |
| [13] | CHAO Wen-di, LV Zhao-zhi, ZHAO Li, ZHANG Xin, GAO Gui-gen, WANG Pei-ling. Research progress on life history types and overwintering hosts of Aphis gossypii [J]. Arid Zone Research, 2019, 36(6): 1537-1549. |
| [14] | SUN Chi-tao, ZHANG Jun-peng, ZHANG Qian, FENG Di, FENG Guo-yi, SUN Jing-sheng, LIN Yong-zeng. Soil Water and Salt Migration in Cotton Field in Ridge Furrow Planting andConventional Flat Planting under Drip Irrigation [J]. Arid Zone Research, 2019, 36(2): 307-313. |
| [15] | YANG Juan, WANG You-ke, LI Jie, CHEN Na, LI Xiao-gang, ZHANG Xiao-na. Parameter Difference of Chlorophyll Fluorescence in Leaves of Different Cultivars of Lycium barbarum [J]. , 2014, 31(3): 550-555. |
|
||