Arid Zone Research ›› 2023, Vol. 40 ›› Issue (5): 691-702.doi: 10.13866/j.azr.2023.05.02
• Weather and Climate • Previous Articles Next Articles
ZHAO Keming1( ),SUN Mingjing1,LI Xia2(),SHI Junjie1,AN Dawei1,XU Tingting1
Received:2023-01-09
Revised:2023-03-21
Online:2023-05-15
Published:2023-05-30
ZHAO Keming, SUN Mingjing, LI Xia, SHI Junjie, AN Dawei, XU Tingting. Comparison of the distribution and applicability of two typical atmospheric diffusion indices in Xinjiang[J].Arid Zone Research, 2023, 40(5): 691-702.
Add to citation manager EndNote|Reference Manager|ProCite|BibTeX|RefWorks
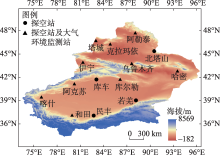
Fig. 1
Distribution diagram of the 14 radiosonde stations in Xinjiang"
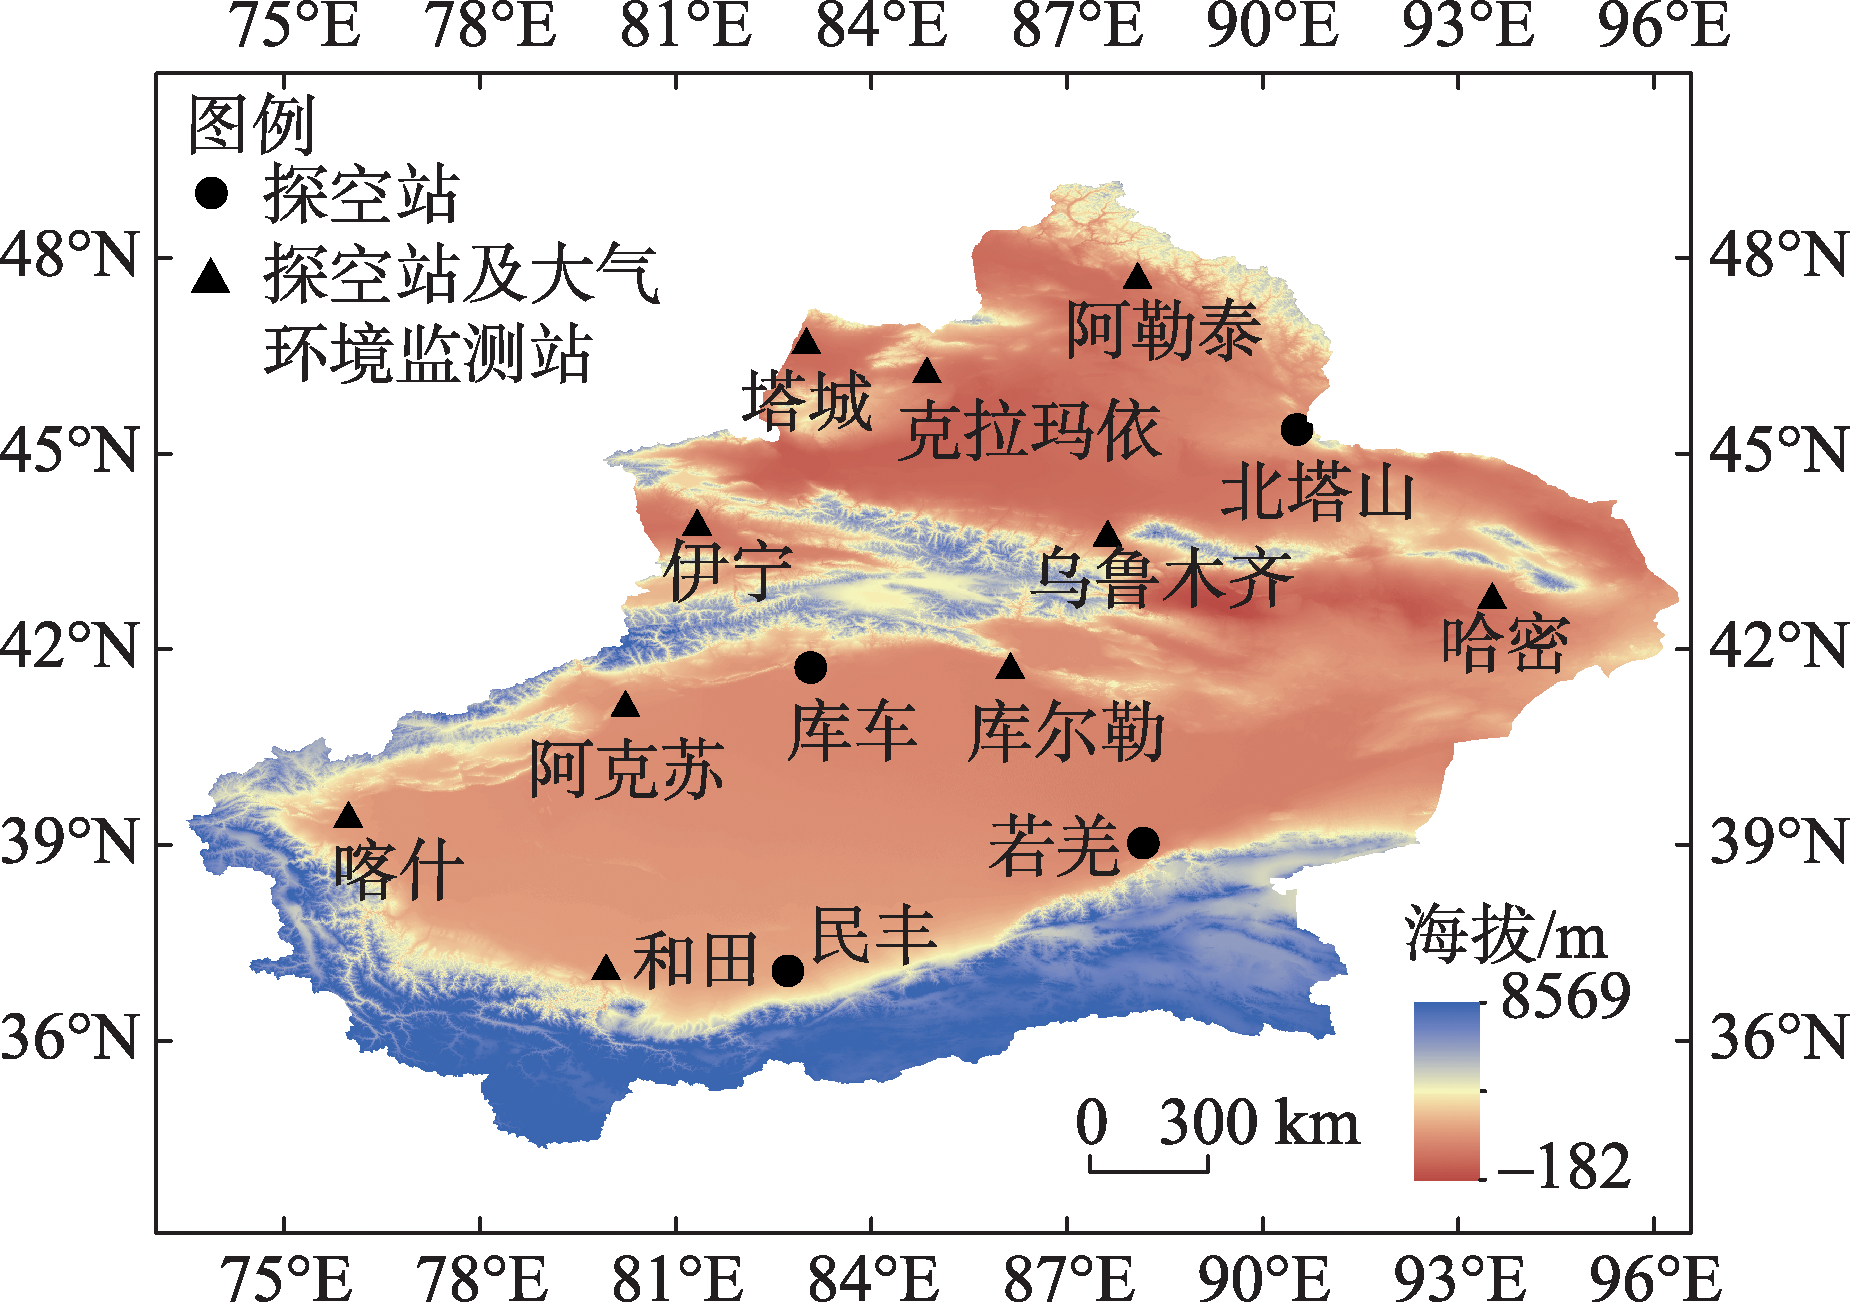
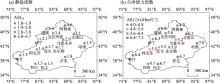
Fig. 2
Annual average distribution of ASI and ASITS in Xinjiang from 2010 to 2020"
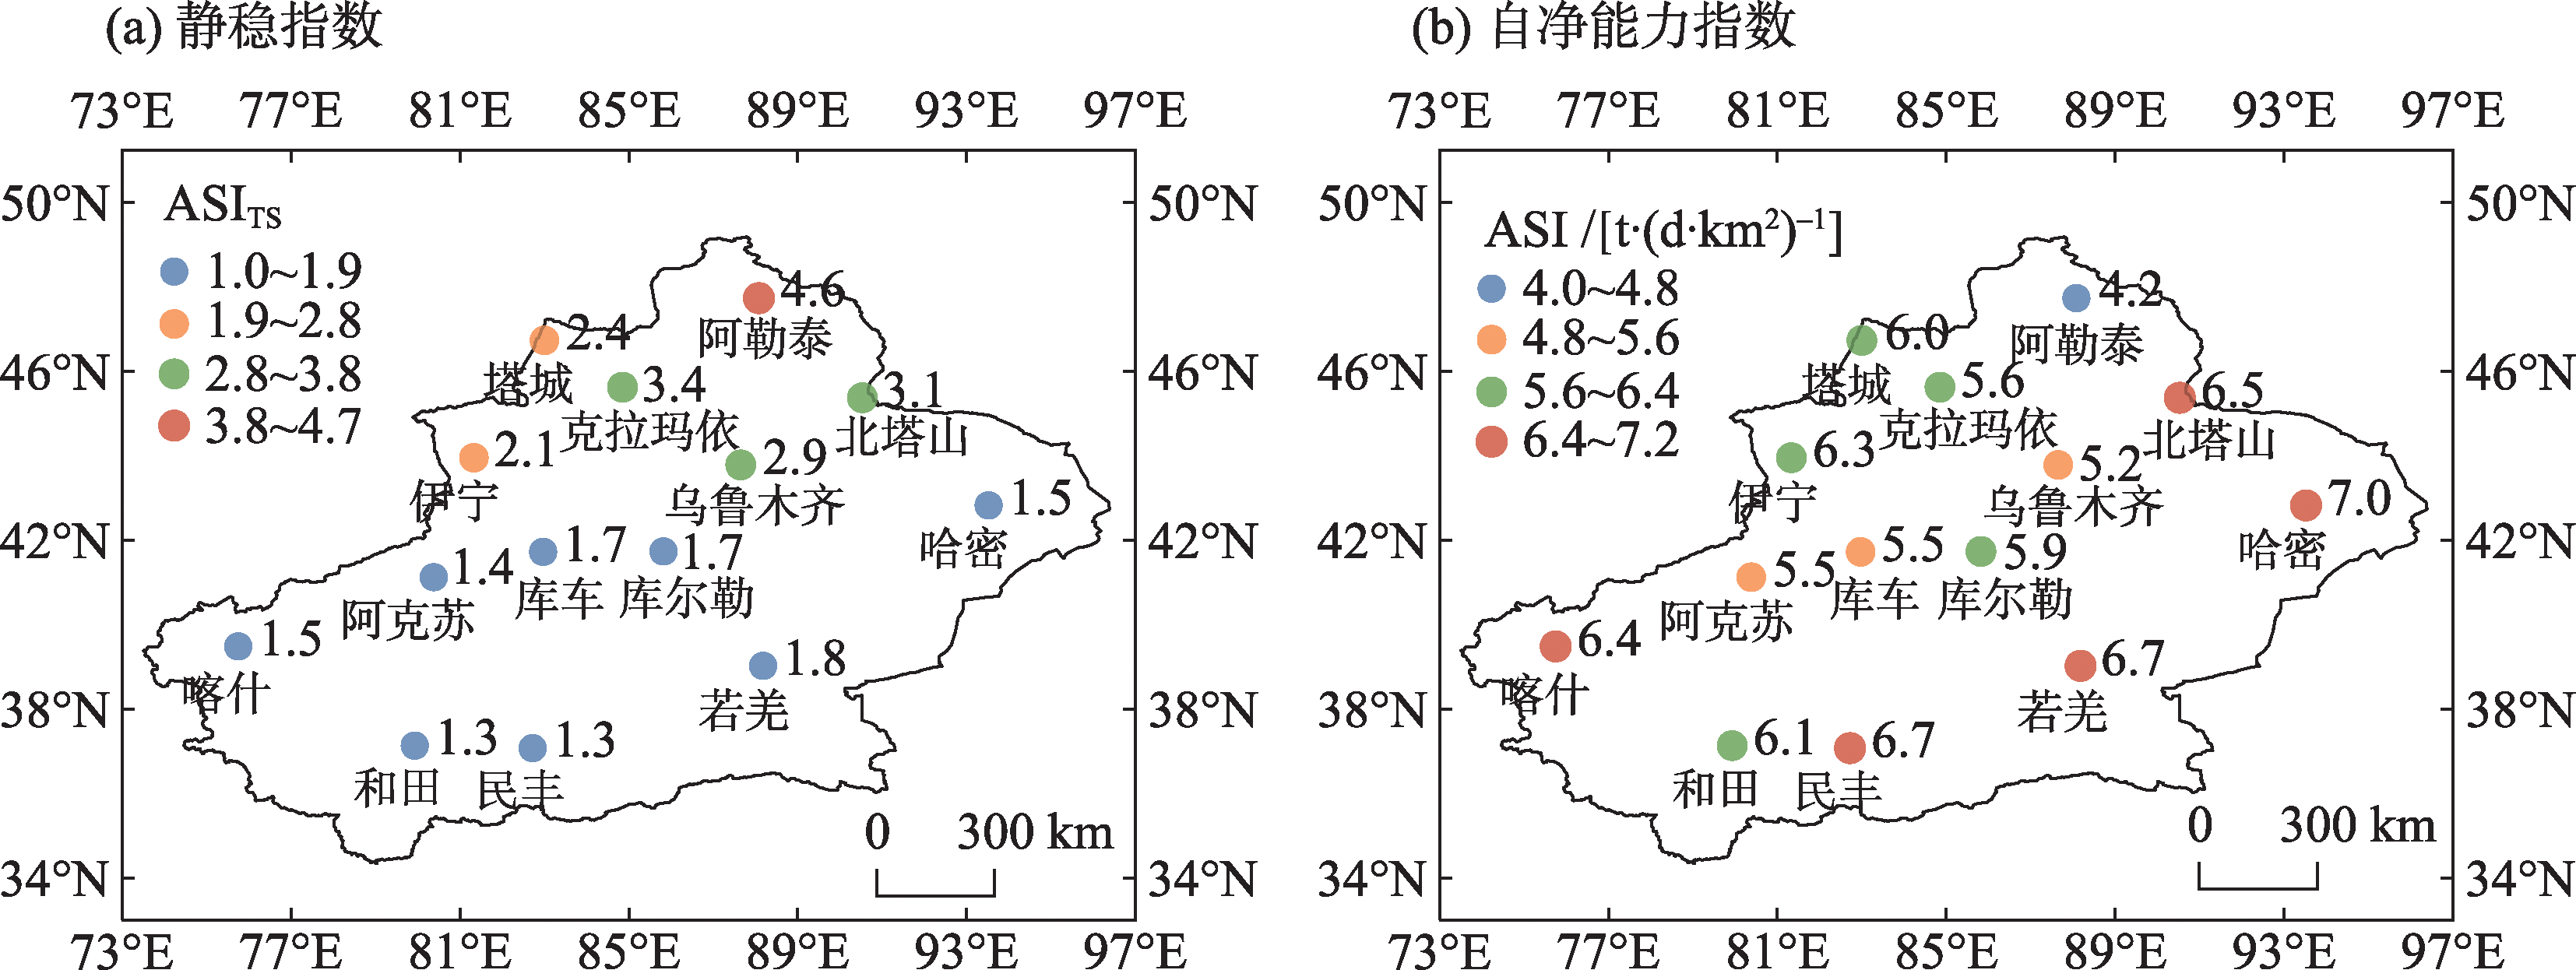
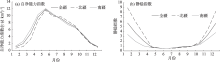
Fig. 3
Monthly average of ASI and ASITS in Xinjiang from 2010 to 2020"

Tab. 1
Seasonal distribution of ASI and ASITS in different regions of Xinjiang"
| 指数 | 季节 | 全疆 | 南疆 | 北疆 |
|---|---|---|---|---|
| 大气自净 能力指数 | 春 | 7.8 | 9.6 | 8.8 |
| 夏 | 9.4 | 9.0 | 9.2 | |
| 秋 | 4.5 | 4.5 | 4.5 | |
| 冬 | 0.9 | 1.7 | 1.4 | |
| 静稳指数 | 春 | 1.1 | 0.8 | 4.6 |
| 夏 | 0.7 | 0.7 | 0.6 | |
| 秋 | 1.9 | 1.6 | 2.4 | |
| 冬 | 5.1 | 3.1 | 7.7 |
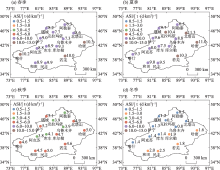
Fig. 4
Space distribution of average ASI in different seasons in Xinjiang from 2010 to 2020"

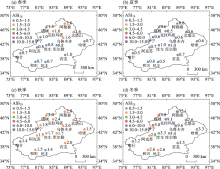
Fig. 5
Space distribution of average ASITS in different seasons in Xinjiang from 2010 to 2020"

Tab. 2
Correlation coefficient between ASI and ASITS in different regions"
| 南疆 | 北疆 | 全疆 | |
|---|---|---|---|
| 站数/个 | 5 | 5 | 10 |
| 时间样本/个 | 60 | 60 | 60 |
| 相关系数 | -0.86* | -0.89* | -0.89* |
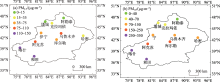
Fig. 6
Annual average distribution of PM2.5 (a) and PM10 (b) concentrations in Xinjiang"

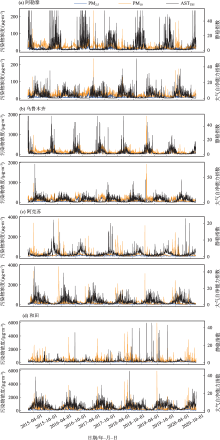
Fig. 7
Daily time series of ASI and ASITS with PM2.5 and PM10"

Tab. 3
Correlation coefficient between ASI and ASITS with PM2.5 and PM10 in representative cities"
| 指数 | 污染物 | 阿勒泰 | 乌鲁木齐 | 阿克苏 | 和田 |
|---|---|---|---|---|---|
| 静稳指数 | PM2.5 | 0.24* | 0.37* | 0.17* | -0.01 |
| PM10 | 0 | 0.25* | 0.03 | -0.01 | |
| 大气自净能力指数 | PM2.5 | -0.23* | -0.4* | -0.05 | 0.1 |
| PM10 | 0.03 | -0.27* | 0.01 | 0.13* |
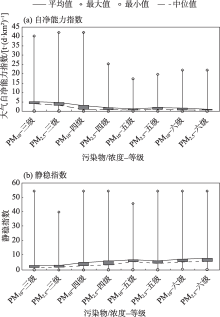
Fig. 8
Distribution of ASI and ASITS at different pollution levels"

| [1] | 藏晓芳, 邓文叶, 王志煌. 新疆“十三五”城市空气质量评价分析[J]. 新疆环境保护, 2021, 43(1): 1-9. |
| [Zang Xiaofang, Deng Wenye, Wang Zhihuang. Evaluation of urban air quality in Xinjiang during the 13th five-year plan period[J]. Xinjiang Environmental Protection, 2021, 43(1): 1-9. ] | |
| [2] | Guo S, Hu M, Zamora M L, et al. Elucidating severe urban haze formation in China[J]. Proceedings of the National Academy of Sciences of the United States of America, 2014, 49(111): 17373-17378. |
| [3] |
Zhang R H, Li Q, Zhang R N. Meteorological conditions for the persistent severe fog and haze event over eastern China in January 2013[J]. Science China: Earth Sciences, 2014, 57: 26-35.
doi: 10.1007/s11430-013-4774-3 |
| [4] |
Wang Z F, Li J, Wang Z, et al. Modeling study of regional severe hazes over mid-eastern China in January 2013 and its implications on pollution prevention and control[J]. Science China: Earth Sciences, 2014, 57: 3-13.
doi: 10.1007/s11430-013-4793-0 |
| [5] | 吴兑. 关于霾与雾的区别和灰霾天气预警的讨论[J]. 气象, 2005, 31(4): 3-7. |
| [Wu Dui. A Discussion on difference between haze and fog and warning of ash haze weather[J]. Meteorological Monthly, 2005, 31(4): 3-7. ] | |
| [6] |
Ding A J, Huang H, Nie W, et al. Enhanced haze pollution by black carbon in megacities in China[J]. Geophysical Research Letters, 2016, 43(6): 2873-2879.
doi: 10.1002/grl.v43.6 |
| [7] | Che H, Zhang X, Li Y, et al. Horizontal visibility trends in China 1981-2005[J]. Geophysical Research Letters, 2007, 34(24): 497-507. |
| [8] | 朱蓉, 张存杰, 梅梅. 大气自净能力指数的气候特征与应用研究[J]. 中国环境科学, 2018, 38(10): 3601-3610. |
| [Zhu Rong, Zhang Cunjie, Mei Mei. The climate characteristics of atmospheric self-cleaning ability index and its application in China[J]. China Environmental Science, 2018, 38(10): 3601-3610. ] | |
| [9] | Ma Yongjing, Ye Jianhuai, Xin Jinyuan, et al. The stove, dome, and umbrella effects of atmospheric aerosol on the development of the planetary boundary layer in hazy regions[J]. Geophysical Research Letters, 2020, 47(13): e2020GL087373. |
| [10] | Wang L L, Wang Y S, Sun Y, et al. Using synoptic classification and trajectory analysis to assess air quality during the winter heating period in Urumqi[J]. Advance in Atmospheric Science, 2012, 29(2): 307-319. |
| [11] | Wang Z L, Huang X, Ding A J. Dome effect of black carbon and its key influencing factors: A one-dimensional modelling study[J]. Atmospheric Chemistry & Physics, 2018, 18(4): 2821-2834. |
| [12] | 赵晨曦, 王云琦, 王玉杰, 等. 北京地区冬春PM2. 5和PM10污染水平时空分布及其与气象条件的关系[J]. 环境科学, 2014, 35(2): 418-427. |
| [Zhao Chenxi, Wang Yunqi, Wang Yujie, et al. Temporal and spatial distribution of PM2.5 and PM10 pollution status and the correlation of particulate matters and meteorological factors during winter and spring in Beijing[J]. Environmental Science, 2014, 35(2): 418-427. ] | |
| [13] | 潘晨, 康志明. 2001—2019年气象条件对江苏PM2.5分布的影响[J]. 环境科学, 2022, 43(2): 649-662. |
| [Pan Chen, Kang Zhiming. Impact of meteorological conditions on PM2.5 in Jiangsu province from 2001 to 2019[J]. Environmental Science, 2022, 43(2): 649-662. ] | |
| [14] | Chen C, Sun Y L, Xu W Q, et al. Characteristics and sources of submicron aerosols above the urban canopy (260 m) in Beijing China during the 2014 APEC summit[J]. Atmospheric Chemistry and Physics, 2015, 15(22): 12879-12895. |
| [15] | Zhao X J, Zhao P S, Xu J, et al. Analysis of a winter regional haze event and its formation mechanism in the North China Plain[J]. Atmospheric Chemistry and Physics, 2013, 13(11): 5685-5696. |
| [16] | 王健, 吴彦, 刘晖. 乌鲁木齐市地面风场特征及其对空气污染影响初探[J]. 新疆环境保护, 2008, 30(3): 24-28. |
| [Wang Jian, Wu Yan, Liu Hui. Characteristics of surface wind field and its impact on air pollution in Urumqi[J]. Xinjiang Environmental Protection, 2008, 30(3): 24-28. ] | |
| [17] | 赵克明, 李霞, 杨静. 乌鲁木齐大气最大混合层厚度变化的环境响应[J]. 干旱区研究, 2011, 28(3): 509-513. |
| [Zhao Keming, Li Xia, Yang Jing. Envirenmental response to variation of the atmospheric maximum mixing depth in Urumqi[J]. Arid Zone Research, 2011, 28(3): 509-513. ] | |
| [18] | 闵月. 天山北坡乌昌石地区污染天气过程的气象特征研究[D]. 兰州: 兰州大学, 2020: 16-24. |
| [Min Yue. The Meteorological Characteristics of Air Pollution in Northern Slope of Tianshan Mountains[D]. Lanzhou: Lanzhou University, 2020: 16-24. ] | |
| [19] | 苏秋芳, 冯鑫媛, 韩晶晶, 等. 2014年冬季至2017年春季干、湿西南涡活动对四川盆地空气污染影响的对比研究[J]. 气象与环境科学, 2019, 42(3): 78-85. |
| [Su Qiufang, Feng Xinyuan, Han Jingjing, et al. Comparative study on the effect of dry and wet southwest vortex activity on air pollution in Sichuan Basin from winter 2014 to spring 2017[J]. Meteorological and Environmental Sciences, 2019, 42(3): 78-85. ] | |
| [20] | 林廷坤, 屈坤, 严宇, 等. 北京市秋冬季环流型下的细颗粒物传输[J]. 中国环境科学, 2021, 41(2): 548-557. |
| [Lin Tingkun, Qu Kun, Yan Yu, et al. Fine particulate matter transport driven by circulation types in autumn and winter over Beijing area[J]. China Environmental Science, 2021, 41(2): 548-557. ] | |
| [21] |
Cai W J, Li K, Liao H, et al. Weather conditions conducive to Beijing severe haze more frequent under climate change[J]. Nature Climate Change, 2017, 7: 257-262.
doi: 10.1038/nclimate3249 |
| [22] | Zhao X J, Zhao P S, Xu J, et al. Analysis of a winter regional haze event and its formation mechanism in the North China Plain[J]. Atmospheric Chemistry and Physics, 2013, 13(11): 5685-5696. |
| [23] | Han Z, Zhou B, Xu Y. Projected changes in haze pollution potential in China: An ensemble of regional climate model simulations[J]. Atmospheric Chemistry and Physics, 2017, 17: 10109-10123. |
| [24] | 国家气候中心, 国家气象中心,. 大气自净能力等级(GB/T34299-2017)[S]. 北京: 中华人民共和国国家质量监督检验检疫总局, 中国国家标准化管理委员会, 2017. |
| [National Climate Centre, National Meteorological Center. Grads of Atmospheric Self-purification Capability (GB/T34299-2017)[S]. Beijing: General Administration of Quality Supervision, Inspection and Quarantine of the People’s Republic of China, Standardization Administration of China, 2017. ] | |
| [25] | 罗玉, 陈超, 张天宇, 等. 1981—2017年四川省大气自净能力变化特征分析[J]. 中国环境科学, 2021, 41(2): 527-536. |
| [Luo Yu, Chen Chao, Zhang Tianyu, et al. Analysis on the characteristics of atmospheric self-cleaning ability index in Sichuan Province from 1981 to 2017[J]. China Environmental Science, 2021, 41(2): 527-536. ] | |
| [26] | 刘美, 姬兴杰, 左璇, 等. 1961—2019年黄河流域大气自净能力指数变化特征分析[J]. 中国环境科学, 2021, 41(12): 5591-5601. |
| [Liu Mei, Ji Xingjie, Zuo Xuan. Variation characteristics of atmospheric self-purification capacity index over the Yellow River Basin during 1961-2019[J]. China Environmental Science, 2021, 41(12): 5591-5601. ] | |
| [27] | Huang Q Q, Cai X H, Wang J, et al. Climatological study of the boundary-layer air stagnation index for China and its relationship with air pollution[J]. Atmospheric Chemistry and Physics, 2018, 18: 7573-7593. |
| [28] | 孙鸣婧, 李霞, 赵克明, 等. 基于探空数据的新疆大气扩散条件时空分布特征分析[J]. 干旱区地理, 2022, 45(1): 113-121. |
| [Sun Mingjing, Li Xia, Zhao Keming, et al. Spatial and temporal characteristics of atmospheric diffusion conditions in Xinjiang based on radiosonde data[J]. Arid Land Geography, 2022, 45(1): 113-121. ] | |
| [29] |
郭宇宏, 迪丽努尔·塔力甫, 康宏, 等. 新疆部分城市可吸入颗粒物的浓度及粒径分布[J]. 环境科学与技术, 2012, 35(S12): 240-244.
doi: 10.1021/es0010507 |
|
[Guo Yuhong, Dilnur Talip, Kang Hong, et al. The size distribution of fine particle matters in some cities in Xinjiang[J]. Environmental Science and Technology, 2012, 35(S12): 240-244. ]
doi: 10.1021/es0010507 |
|
| [30] | 马禹, 王旭, 黄镇, 等. 新疆沙尘天气的演化特征及影响因子[J]. 干旱区地理, 2006, 29(2): 178-185. |
| [Ma Yu, Wang Xu, Huang Zhen. Evolutionary characteristics and influencing factors of sand dust weather in Xinjiang[J]. Arid Land Geography, 2006, 29(2): 178-185. ] | |
| [31] | 王式功, 姜大膀, 杨德保, 等. 兰州市区最大混合层厚度变化特征分析[J]. 高原气象, 2000, 19(3): 363-369. |
| [Wang Shigong, Jiang Dabang, Yang Debao, et al. A study on characteristics of change of maximum mixing depths in Lanzhou[J]. Plateau Meteorology, 2000, 19(3): 363-370. ] | |
| [32] |
Jin F, Quan J, Hong L. et al. An air stagnation index to qualify extreme haze events in northern China[J]. Journal of the Atmospheric Sciences, 2018, 75: 3489-3506.
doi: 10.1175/JAS-D-17-0354.1 |
| [33] |
张天宇, 张丹, 王勇. 等. 1951—2018年重庆主城区大气自净能力变化特征分析[J]. 高原气象, 2019, 38(4): 901-910.
doi: 10.7522/j.issn.1000-0534.2019.00030 |
|
[Zhang Tianyu, Zhang Dan, Wang Yong, et al. analysis of variation characteristics of atmospheric self-pollution capability in the main urban area of Chong Qing from 1951-2018[J]. Plateau Meteorology, 2019, 38(4): 901-910. ]
doi: 10.7522/j.issn.1000-0534.2019.00030 |
|
| [34] | 井元元, 李宏宇, 张婧, 等. 1961—2017年华北区域大气自净能力变化特征及其影响因素分析[J]. 热带气象学报, 2021, 37(2): 233-244. |
| [Jing Yuanyuan, Li Hongyu, Zhang Jing. Analysis of characteristics and influencing factors of atmosphere self-purification capacity in north China during 1961-2017[J]. Journal of Tropical Meteorology, 2021, 37(2): 233-244. ] | |
| [35] | 谢运兴, 唐晓, 郭宇宏, 等. 新疆大气颗粒物的时空分布特征[J]. 中国环境监测, 2019, 35(1): 26-36. |
| [Xie Yunxing, Tang Xiao, Guo Yuhong. Spatial and temporal distribution of atmospheric particulate matter in Xinjiang[J]. Environmental Monitoring in China, 2019, 35(1): 26-36. ] |
| [1] | LI Xiaofeng, HUI Tingting, LI Yaoming, MAO Jiefei, WANG Guangyu, FAN Lianlian. Effects of different grazing management strategies on plant diversity in the mountain grassland of Xinjiang, China [J]. Arid Zone Research, 2024, 41(1): 124-134. |
| [2] | CHEN Aijun,Yin . Spatiotemporal distribution of precipitation in five Central Asian countries based on FY-4A quantitative precipitation estimates [J]. Arid Zone Research, 2023, 40(9): 1369-1381. |
| [3] | WANG Xiang, LYU Haishen, ZHU Yonghua, GUO Chenyu. Application and comparison of two channel flood routing methods in Xinjiang mountainous areas [J]. Arid Zone Research, 2023, 40(8): 1240-1247. |
| [4] | MA Jilong, SHI Junhui, WANG Xinying, Aliya BAIDOURELA, LIU Maoxiu, Aijier ABULA. Effects of flood overflow on soil organic carbon and active components of Populus euphratica forest in the middle reaches of the Tarim River [J]. Arid Zone Research, 2023, 40(8): 1248-1257. |
| [5] | WANG Chao, MA Zhancang, PAN Chengnan, WU Xingyue, SONG Wendan, YAN Ping. New records of Amaranthus in Xinjiang [J]. Arid Zone Research, 2023, 40(8): 1280-1288. |
| [6] | Gulistan ANWAR, Turgun NURDIN, Dilhumar ABDUKERIM, Mamtimin SULAYMAN. New records of mosses of Leskeaceae to Xinjiang [J]. Arid Zone Research, 2023, 40(8): 1289-1293. |
| [7] | LI Hong, LI Zhongqin, CHEN Puchen, PENG Jiajia. Spatio-temporal variation of snow cover in Altai Mountains of Xinjiang in recent 20 years and its influencing factors [J]. Arid Zone Research, 2023, 40(7): 1040-1051. |
| [8] | XU Junli, HAN Haidong, WANG Jian. Recharge sources and potential source areas of atmospheric PM2.5 in Xinjiang [J]. Arid Zone Research, 2023, 40(6): 874-884. |
| [9] | XUE Yibo, HUANG Shuangyan, ZHANG Xiaoxiao, LEI Jiaqiang, LI Shengyu. Study on the strong winter airborne dustfall mixed rain and snow events in Xinjiang, China in 2018 [J]. Arid Zone Research, 2023, 40(5): 681-690. |
| [10] | ZHAO Yuzhi,YANG Jianjun. Spatio-temporal pattern of water resource carrying capacity, coupling and coordination of subsystems in southern Xinjiang [J]. Arid Zone Research, 2023, 40(2): 213-223. |
| [11] | DONG Hanlin, WANG Wenting, XIE Yun, Aydana YESINALI, JIANG Yuantian, XU Jiaqi. Climate dry-wet conditions, changes, and their driving factors in Xinjiang [J]. Arid Zone Research, 2023, 40(12): 1875-1884. |
| [12] | WU Xiaodan,LUO Min,MENG Fanhao,SA Chula,YIN Chaohua,BAO Yuhai. New characteristics of spatio-temporal evolution of extreme climate events in Xinjiang under the background of warm and humid climate [J]. Arid Zone Research, 2022, 39(6): 1695-1705. |
| [13] | JIANG Lei,ZHAO Yi,ZHANG Pengwei,HE Liang,BAI Xiang. Study on influence degree of phreatic evaporation based on hydrogen and oxygen isotope characteristics [J]. Arid Zone Research, 2022, 39(6): 1793-1800. |
| [14] | Mamtimin SULAYMAN,Alanur KAHAR,LIANG Lingwei,Mamurbieke MAKAN,WANG Pengjun. Discovery of a moss family Schistostegaceae in Xinjiang, China [J]. Arid Zone Research, 2022, 39(6): 1852-1855. |
| [15] | Gulistan ANWAR,WANG Pengjun,Alanur KAHAR,Mamtimin SULAYMAN. Buxbaumia viridis, a newly recorded species in Xinjiang, China and its historical correction in China’s distribution [J]. Arid Zone Research, 2022, 39(6): 1856-1861. |
|
||