Arid Zone Research ›› 2022, Vol. 39 ›› Issue (2): 510-521.doi: 10.13866/j.azr.2022.02.19
• Plant and Plant Physiology • Previous Articles Next Articles
CAO Yongxiang1( ),MAO Donglei1,Xue Jie2,3(),SU Songling1,Kaimaierguli Abulaiti1,CAI Fuyan4
Received:2021-08-17
Revised:2021-12-13
Online:2022-03-15
Published:2022-03-30
Contact:
Jie Xue
E-mail:1298668601@qq.com;xuejie11@ms.xjb.ac.cn
CAO Yongxiang,MAO Donglei,Xue Jie,SU Songling,Kaimaierguli Abulaiti,CAI Fuyan. Dynamic changes and driving factors of vegetation cover in the oasis-desert ecotone: A case study of Cele, Xinjiang[J].Arid Zone Research, 2022, 39(2): 510-521.
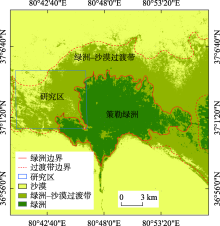
Fig. 1
Overview of the research area"


Fig. 2
Normalized difference vegetation index of Cele oasis-desert ecotone (NDVI)"
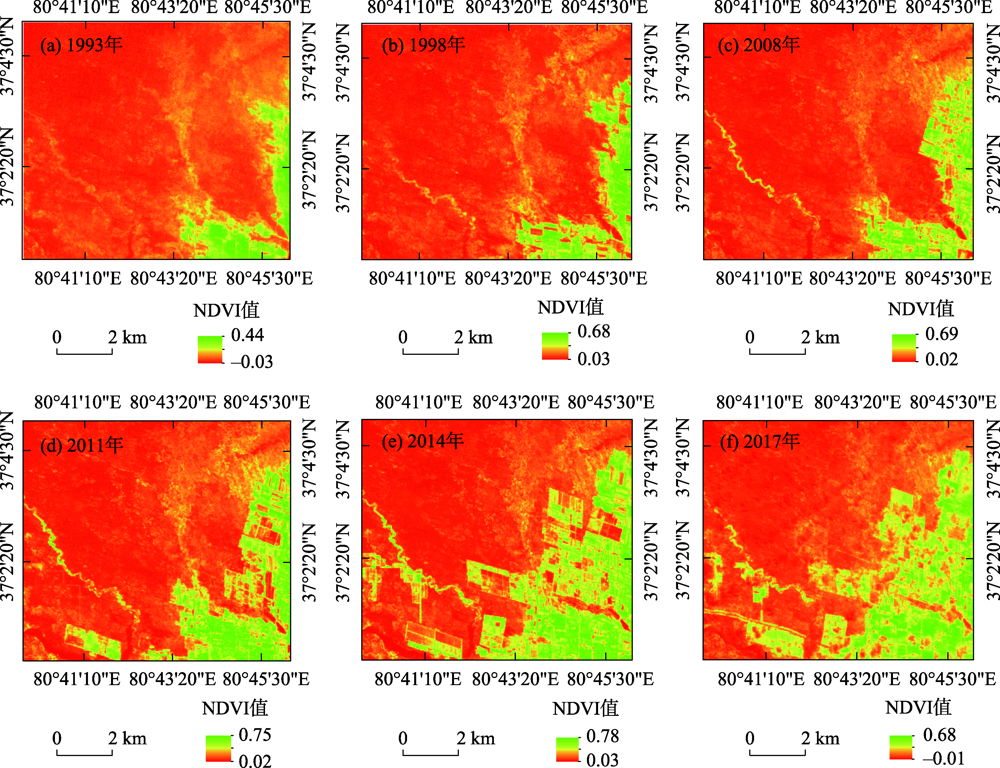
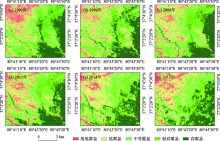
Fig. 3
Spatial distribution of vegetation coverage in Cele oasis-desert ecotone"

Tab. 1
Area and percentage of vegetation coverage of each grade"
| 覆盖等级 | 1993年 | 1998年 | 2008年 | 2011年 | 2014年 | 2017年 | |||||||||||
|---|---|---|---|---|---|---|---|---|---|---|---|---|---|---|---|---|---|
| 面积/km2 | 占比/% | 面积/km2 | 占比/% | 面积/km2 | 占比/% | 面积/km2 | 占比/% | 面积/km2 | 占比/% | 面积/km2 | 占比/% | ||||||
| 极低覆盖 | 7.95 | 9.04 | 4.85 | 5.52 | 5.70 | 6.48 | 7.51 | 8.54 | 5.31 | 6.04 | 6.96 | 7.91 | |||||
| 低覆盖 | 16.04 | 18.25 | 19.10 | 21.74 | 20.16 | 22.94 | 18.71 | 21.29 | 20.41 | 23.22 | 18.77 | 21.36 | |||||
| 中等覆盖 | 27.32 | 31.09 | 28.17 | 32.06 | 26.50 | 30.16 | 26.14 | 29.74 | 26.96 | 30.67 | 26.94 | 30.65 | |||||
| 较高覆盖 | 18.78 | 21.37 | 17.90 | 20.36 | 17.76 | 20.21 | 17.95 | 20.42 | 17.48 | 19.89 | 17.60 | 20.03 | |||||
| 高覆盖 | 17.79 | 20.25 | 17.86 | 20.32 | 17.76 | 20.20 | 17.59 | 20.01 | 17.42 | 20.17 | 17.61 | 20.04 | |||||
Tab. 2
Range, area and proportion of FVC grade change"
| 变化程度 | 值域范围 | 1993—1998年 | 1998—2008年 | 2008—2011年 | 2011—2014年 | 2014—2017年 | 1993—2017年 | |||||||||||
|---|---|---|---|---|---|---|---|---|---|---|---|---|---|---|---|---|---|---|
| 面积/km2 | 占比/% | 面积/km2 | 占比/% | 面积/km2 | 占比/% | 面积/km2 | 占比/% | 面积/km2 | 占比/% | 面积/km2 | 占比/% | |||||||
| 明显变差 | D<-1.5 | 1.82 | 2.07 | 1.07 | 1.22 | 0.87 | 0.90 | 0.09 | 0.09 | 1.73 | 1.97 | 3.49 | 3.97 | |||||
| 轻微变差 | -1.≤D<-0.5 | 14.10 | 16.05 | 18.94 | 21.55 | 15.17 | 17.26 | 17.97 | 20.44 | 15.10 | 17.18 | 22.77 | 25.91 | |||||
| 基本不变 | -0.5≤D<0.5 | 53.37 | 60.73 | 52.46 | 59.70 | 60.30 | 68.61 | 54.73 | 62.27 | 56.00 | 63.72 | 41.28 | 46.97 | |||||
| 轻微变好 | 0.5≤D<2.5 | 17.24 | 19.61 | 13.47 | 15.33 | 9.79 | 11.14 | 9.86 | 11.21 | 13.41 | 15.26 | 15.35 | 17.46 | |||||
| 明显变好 | D≥2.5 | 1.35 | 1.54 | 1.94 | 2.21 | 1.76 | 2.00 | 3.43 | 3.90 | 1.65 | 1.88 | 5.00 | 5.69 | |||||
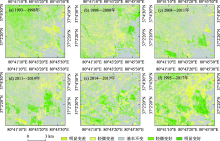
Fig. 4
The grade of FVC change"

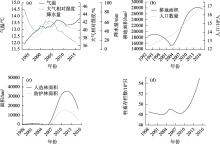
Fig. 5
The changing trend of meteorology and elements of human activity"

Tab. 3
Correlation matrix of the evaluation index"
| 要素指标 | 降水量 | 气温 | 大气相对湿度 | 人口 | 耕地面积 | 造林面积 | 防护林面积 | 牲畜存栏数 |
|---|---|---|---|---|---|---|---|---|
| 降水量 | 1.000 | |||||||
| 气温 | 0.440 | 1.000 | ||||||
| 大气相对湿度 | 0.512 | -0.361 | 1.000 | |||||
| 人口数量 | 0.181 | 0.128 | -0.437 | 1.000 | ||||
| 耕地面积 | 0.279 | 0.310 | -0.347 | 0.773 | 1.000 | |||
| 造林面积 | 0.482 | 0.012 | 0.038 | 0.592 | 0.542 | 1.000 | ||
| 防护林面积 | 0.294 | 0.119 | -0.143 | 0.419 | 0.483 | 0.897 | 1.000 | |
| 牲畜存栏数 | -0.123 | 0.005 | -0.439 | 0.551 | -0.061 | 0.223 | 0.075 | 1.000 |
Tab. 4
The index characteristic value and contribution rate"
| 主成分 | 特征值 | 贡献率/% | 累积率/% |
|---|---|---|---|
| 第一主成分 | 3.251 | 40.634 | 40.634 |
| 第二主成分 | 1.901 | 23.760 | 64.394 |
| 第三主成分 | 1.268 | 15.851 | 80.245 |
Tab. 5
Loading matrix of principal component"
| 变量 | 第一主成分 | 第二主成分 | 第三主成分 |
|---|---|---|---|
| 造林面积 | 0.850 | 0.325 | -0.374 |
| 耕地面积 | 0.810 | 0.001 | 0.225 |
| 人口数量 | 0.853 | -0.312 | -0.099 |
| 防护林面积 | 0.779 | 0.232 | -0.252 |
| 大气相对湿度 | -0.352 | 0.845 | -0.280 |
| 降水量 | 0.421 | 0.753 | 0.260 |
| 牲畜存栏数 | 0.344 | -0.608 | -0.281 |
| 气温 | 0.345 | 0.017 | 0.883 |
| [1] | Forkel M, Carvalhais N, Rödenbeck C, et al. Enhanced seasonal CO2 exchange caused by amplified plant productivity in Northern ecosystems[J]. Science, 2016, 6274:696-699. |
| [2] |
Peng J, Liu Z H, Liu Y H, et al. Trend analysis of vegetation dynamics in Qinghai-Tibet plateau using hurst exponent[J]. Ecological Indicators, 2012, 14(1):28-39.
doi: 10.1016/j.ecolind.2011.08.011 |
| [3] | 包刚, 覃志豪, 包玉海, 等. 1982—2006年蒙古高原植被覆盖时空变化分析[J]. 中国沙漠, 2013, 33(3):916-927. |
| [ Bao Gang, Qin Zhihao, Bao Yuhai, et al. Spatial-temporal changes of vegetation cover in Mongolian Plateau during 1982-2006[J]. Journal of Desert Research, 2013, 33(3):916-927. ] | |
| [4] | 祁燕, 王秀兰, 冯仲科, 等. 基于RS与GIS的北京市植被覆盖度变化研究[J]. 林业调查规划, 2009, 34(2):1-4. |
| [ Qi Yan, Wang Xiulan, Feng Zhongke, et al. Study on coverage changes of the vegetation in Beijing City based on RS and GIS[J]. Forest Inventory and Planning, 2009, 34(2):1-4. ] | |
| [5] | 马志勇, 沈涛, 张军海, 等. 基于植被覆盖度的植被变化分析[J]. 测绘通报, 2007(3):45-48. |
| [ Ma Zhiyong, Shen Tao, Zhang Junhai, et al. Vegetation changes analysis based on vegetation coverage[J]. Bulletin of Surveying and Mapping, 2007(3):45-48. ] | |
| [6] | 甘春英, 王兮之, 李保生, 等. 连江流域近18年来植被覆盖度变化分析[J]. 地理科学, 2011, 31(8):1019-1024. |
| [ Gan Chunying, Wang Xizhi, Li Baosheng, et al. Changes of vegetation coverage during recent 18 years in Lianjiang River watershed[J]. Scientia Geographica Sinica, 2011, 31(8):1019-1024. ] | |
| [7] | 董璐, 赵杰, 刘雪佳, 等. 1982—2015年新疆地区植被生长对气温的响应[J]. 应用生态学报, 2019, 30(7):2165-2170. |
| [ Dong Lu, Zhao Jie, Liu Xuejia, et al. Responses of vegetation growth to temperature during 1982-2015 in Xinjiang, China[J]. Chinese Journal of Applied Ecology, 2019, 30(7):2165-2170. ] | |
| [8] | 慈晖, 张强. 新疆NDVI时空特征及气候变化影响研究[J]. 地球信息科学, 2017, 19(5):662-671. |
| [ Ci Hui, Zhang Qiang. Spatio-temporal patterns of NDVI variations and possible relations with climate changes in Xinjiang Province[J]. Journal of Geo-Information Science, 2017, 19(5):662-671. ] | |
| [9] | 丁玥, 阿布都热合曼·哈力克, 陈香月, 等. 和田地区植被覆盖变化及气候因子驱动分析[J]. 生态学报, 2020, 40(4):1258-1268. |
| [ Ding Yue, Abudureheman Halike, Chen Xiangyue, et al. Spatial-temporal changes in vegetation characteristics and climate in Hotan prefecture[J]. Acta Ecologica Sinica, 2020, 40(4):1258-1268. ] | |
| [10] | 陈秀妍, 付碧宏, 时丕龙, 等. 2000—2016年中亚天山植被变化及气候分异研究[J]. 干旱区地理, 2019, 42(1):162-171. |
| [ Chen Xiuyan, Fu Bihong, Shi Pilong, et al. Vegetation dynamics in response to climate change in Tianshan, Central Asia from 2000 to 2016[J]. Arid Land Geography, 2019, 42(1):162-171. ] | |
| [11] | 马梓策, 于红博, 曹聪明, 等. 中国植被覆盖度时空特征及其影响因素分析[J]. 长江流域资源与环境, 2020, 29(6):1310-1321. |
| [ Ma Zice, Yu Hongbo, Cao Congming, et al. Spatio temporal characteristics of fractional vegetation coverage and its influencing factors in China[J]. Resources and Environment in the Yangtze Basin, 2020, 29(6):1310-1321. ] | |
| [12] | 刘海, 刘凤, 郑粮. 气候变化及人类活动对黄河流域植被覆盖变化的影响[J]. 水土保持学报, 2021, 25(4):143-151. |
| [ Liu Hai, Liu Feng, Zheng Liang. Effects of climate change and human activities on vegetation cover change in the Yellow River basin[J]. Journal of Soil and Water Conservation, 2021, 25(4):143-151. ] | |
| [13] | 董弟文, 阿布都热合曼·哈力克, 王大伟, 等. 1994—2016年和田绿洲植被覆盖时空变化分析[J]. 生态学报, 2019, 39(10):3710-3719. |
| [ Dong Diwen, Abudureheman Halike, Wang Dawei, et al. Spatio-temporal variations in vegetation cover in Hotan oasis from 1994 to 2016[J]. Acta Ecologica Sinica, 2019, 39(10):3710-3719. ] | |
| [14] | 王玉朝, 赵成义. 绿洲-荒漠生态脆弱带的研究[J]. 干旱区地理, 2001, 24(2):182-188. |
| [ Wand Yuchao, Zhao Chengyi. Study in desert-oasis ecological fragile zone[J]. Arid Land Geography, 2001, 24(2):182-188. ] | |
| [15] | 毛东雷, 雷加强, 王翠, 等. 新疆策勒县沙漠-绿洲过渡带风沙流结构及输沙粒度特征[J]. 水土保持通报, 2015, 35(1):25-33. |
| [ Mao Donglei, Lei Jiaqiang, Wang Cui, et al. Characteristics of sand flown structure and sand transportation particles in Cele desert-oasis ecotone of Xinjiang Wei Autonomous Region[J]. Bulletin of Soil and Water Conservation, 2015, 35(1):25-33. ] | |
| [16] | 周洒洒, 何清, 金莉莉, 等. 塔克拉玛干沙漠北缘绿洲-荒漠过渡带辐射特征——以肖塘为例[J]. 中国沙漠, 2020, 40(4):43-51. |
| [ Zhou Sasa, He Qing, Jin Lili, et al. Radiation characteristics of the oasis-desert transition zone in the northern margin of the Taklimakan Desert: A case study of Xiaotang[J]. Journal of Desert Research, 2020, 40(4):43-51. ] | |
| [17] | 韩福贵, 徐先英, 尉秋实, 等. 民勤绿洲-荒漠过渡带典型固沙植物生殖物候对气候变化的响应[J]. 中国沙漠, 2015, 35(2):330-337. |
| [ Han Fugui, Xu Xianying, Yu Qiushi, et al. Response of reproductive phenology of typical sand-fixing plants to climate change in the oasis-desert transitional zone in Minqin, Gansu, China[J]. Journal of Desert Research, 2015, 35(2):330-337. ] | |
| [18] | 常学礼, 季树新, 乔荣荣, 等. 基于NDVI绿洲-荒漠过渡带宽度识别——以河西走廊中部荒漠绿洲为例[J]. 生态学报, 2020, 40(15):5327-5336. |
| [ Chang Xueli, Ji Shuxin, Qiao Rongrong, et al. NDVI-based identification of oasis-desert transitional zone wideness: A case study in the central Hexi corridor[J]. Acta Ecologica Sinica, 2020, 40(15):5327-5336. ] | |
| [19] | 穆桂金, 贺俊霞, 雷加强, 等. 再议绿洲-沙漠过渡带: 以策勒绿洲-沙漠过渡带为例[J]. 干旱区地理, 2013, 36(2):195-202. |
| [ Mu Guijin, He Junxia, Lei Jiaqiang, et al. A discussion of the transitional zone from oasis to sandy desert: A case study at Cele Oasis[J]. Arid Land Geography, 2013, 36(2):195-202. ] | |
| [20] | 潘光耀, 穆桂金, 岳健, 等. 2001-2010年策勒绿洲-沙漠过渡带的变化及其成因[J]. 干旱区研究, 2014, 31(1):169-175. |
| [ Pan Guangyao, Mu Guijin, Yue Jian, et al. Change of the oasis-desert ecotone and its causes in Qira county during the period of 2001-2010[J]. Arid Zone Research, 2014, 31(1):169-175. ] | |
| [21] | 毛东雷, 雷加强, 曾凡江, 等. 策勒绿洲-沙漠过渡带风沙活动强度的空间分布特征[J]. 水土保持学报, 2013, 27(2):13-19. |
| [ Mao Donglei, Lei Jiaqiang, Zeng Fanjiang, et al. Spatial distribution characteristics of sand blown activities intensity on Cele oasis-desert ecotone[J]. Journal of Soil and Water Conservation, 2013, 27(2):13-19. ] | |
| [22] | 张鹤年. 塔克拉玛干沙漠南缘-绿洲过渡带生态环境区综合治理技术与试验示范研究[J]. 干旱区研究, 1995, 12(4):1-9. |
| [ Zhang Henian. Study on integrated management technology and experimental demonstration of eco-environment zone in Southern margin of Taklimakan Desert and oasis transition zone[J]. Arid Zone Research, 1995, 12(4):1-9. ] | |
| [23] | 阿布都瓦斯提·吾拉木. 绿洲荒漠交错带地下水位分布的遥感模型研究[D]. 乌鲁木齐: 新疆大学, 2000. |
| [ Abuduwasiti·wulamu. Research on Model of Groundwater Level Distribution in Oasis and Desert Ecotone Using Remote Sensing[D]. Urumqi: Xinjiang University, 2000. ] | |
| [24] | 毛东雷, 雷加强, 曾凡江, 等. 新疆策勒沙漠-绿洲过渡带不同下垫面地表蚀积变化特征[J]. 中国沙漠, 2014, 34(4):961-969. |
| [ Mao Donglei, Lei Jiaqiang, Zeng Fanjiang, et al. Sand erosion and deposition on different underlying land surfaces in the desert-oasis ecotone in Cele, Xinjiang, China[J]. Journal of Desert Research, 2014, 34(4):961-969. ] | |
| [25] | 杨帆, 王雪芹, 何清, 等. 绿洲-沙漠过渡带柽柳灌丛沙堆形态特征及空间分布格局[J]. 干旱区研究, 2014, 31(3):556-563. |
| [ Yang Fan, Wang Xueqin, He Qing, et al. Morphological features and spatial distrubution pattern of Tamarix ramosissima Nebkhas in an oasis-desert ecotone[J]. Arid Zone Research, 2014, 31(3):556-563. ] | |
| [26] | 任晓, 穆桂金, 徐立帅, 等. 塔里木盆地南缘2000—2013年人工绿洲扩张特点[J]. 干旱区地理, 2015, 38(5):1022-1030. |
| [ Ren Xiao, Mu Guijin, Xu Lishuai, et al. Characteristics of artificial oasis expansion in south Traim Basin from 2000 to 2013[J]. Arid Land Geography, 2015, 38(5):1022-1030. ] | |
| [27] | 叶贵祥, 李维青, 田源. 基于NDVI的干旱区典型绿洲植被覆盖动态变化分析——以策勒绿洲为例[J]. 干旱区资源与环境, 2009, 23(9):128-133. |
| [ Ye Guixiang, Li Weiqing, Tian Yuan. Dynamic changes of vegetation cover in typical oasis of arid areas based on NDVI[J]. Journal of Arid Land Resources and Environment 2009, 23(9):128-133. ] | |
| [28] | 李向婷, 白洁, 李光录, 等. 新疆荒漠稀疏植被覆盖度信息遥感提取方法比较[J]. 干旱区地理, 2013, 36(3):502-511. |
| [ Li Xiangting, Bai Jie, Li Guanglu, et al. Comparison of methods based on MODIS for estimating sparse vegetation fraction across desert in Xinjiang[J]. Arid Land Geography, 2013, 36(3):502-511. ] | |
| [29] | 陈涛, 李平湘, 张良培. 武汉地区1988—2002年植被覆盖度变化动态分析[J]. 遥感技术与应用, 2008, 23(5):511-516. |
| [ Chen Tao, Li Pingxiang, Zhang Liangpei. Dynamic analysis of vegetation fraction change in Wuhan region from 1988 to 2002[J]. Remote Sensing Technology and Application, 2008, 23(5):511-516. ] | |
| [30] | 田静, 阎雨, 陈圣波. 植被覆盖率遥感研究进展[J]. 国土资源遥感, 2004(1):1-5. |
| [ Tian Jing, Yan Yu, Chen Shengbo. The advances in the application of the remote sensing technique to the estimation of vegetation fractional cover[J]. Remote Sensing for Land & Resources, 2004(1):1-5. ] | |
| [31] | 张号, 屈建军, 张克存. 绿洲植被覆盖度遥感信息提取——以敦煌绿洲为例[J]. 中国沙漠, 2015, 35(2):493-498. |
| [ Zhang Hao, Qu Jianjun, Zhang Kecun. Vegetation cover information extraction technology for Dunhuang oasis based on remote sensing images[J]. Journal of Desert Research, 2015, 35(2):493-498. ] | |
| [32] | 伍超群, 张绪冰, 王耀, 等. 基于Landsat影像的木里煤田矿区植被覆盖提取及时空变化分析[J]. 测绘与空间地理信息, 2020, 43(2):67-72. |
| [ Wu Chaoqun, Zhang Xubing, Wang Yao, et al. Analysis of vegetation coverage extraction and time-space change in Muli coalfield based on landsat image[J]. Geomatics & Spatial Information Technology, 2020, 43(2):67-72. ] | |
| [33] |
王子玉, 许端阳, 杨华, 等. 1981—2010年气候变化和人类活动对内蒙古地区植被动态影响的定量研究[J]. 地理科学进展, 2017, 36(8):1025-1032.
doi: 10.18306/dlkxjz.2017.08.011 |
|
[ Wang Ziyu, Xu Duanyang, Yang Hua, et al. Impacts of climate change and human activities on vegetation dynamics in Inner Mongolia, 1981-2010[J]. Progress in Geography, 2017, 36(8):1025-1032. ]
doi: 10.18306/dlkxjz.2017.08.011 |
|
| [34] | 薛薇. SPSS统计分析方法及应用[M]. 北京: 电子工业出版社, 2013: 262-279. |
| [ Xue Wei. SPSS Statistical Analysis Method And Its Application[M]. Beijing: Publishing House of Electronics Industry, 2013: 262-279. ] | |
| [35] | 刘潇, 薛莹, 纪毓鹏, 等. 基于主成分分析法的黄河口及其邻近水域水质评价[J]. 中国环境科学, 2015, 35(10):3187-3192. |
| [ Liu Xiao, Xue Ying, Ji Yupeng, et al. An assessment of water quality in the Yellow River estuary and its adjacent waters based on principal component analysis[J]. China Environmental Science, 2015, 35(10):3187-3192. ] | |
| [36] | 陈佩. 主成分分析法研究及其在特征提取中的应用[D]. 陕西: 陕西师范大学, 2014. |
| [ Chen Pei. Principal Component Analysis and Its Application in Feature Extraction[D]. Shaanxi: Shaanxi Normal University, 2014. ] | |
| [37] | 毛东雷. 策勒绿洲-沙漠过渡带植被与土壤水分空间异质性研究[J]. 现代农业科技, 2013(13):252-256. |
| [ Mao Donglei. Research on space heterogeneity of vegetation and soil moisture in oasis-desert ecotone in Cele county[J]. Modern Agricultural Science and Technology, 2013(13):252-256. ] | |
| [38] | 杨兴华, 何清, 程玉景, 等. 策勒绿洲-荒漠过渡带风沙前沿近地表沙濡水平通量观测[J]. 干旱区研究, 2013, 30(6):1100-1105. |
| [ Yang Xinghua, He Qing, Cheng Yujing, et al. Near-surface horizontal aeolian sand-dust flax over oasis-desert ecotone in Qira county, Xinjiang[J]. Arid Zone Research, 2013, 30(6):1100-1105. ] | |
| [39] | 李震, 阎福礼, 范湘涛. 中国西北地区NDVI变化及其与温度和降水的关系[J]. 遥感学报, 2005, 20(3):308-313. |
| [ Li Zhen, Yan Fuli, Fan Xiangtao. The variability of NDVI over Northwest China and its relation to temperature and precipitation[J]. National Remote Sensing Bulletin, 2005, 20(3):308-313. ] | |
| [40] | 白红英. 秦巴山区森林植被对环境变化的响应[M]. 北京: 科学出版社, 2014. |
| [ Bai Hongying. The Response of Vegetation to Environmental Change in Qinba Mountains[M]. Beijing: Science Press, 2014. ] | |
| [41] |
郭铌, 朱燕君, 王介民, 等. 近22年来西北不同类型植被NDVI变化与气候因子的关系[J]. 植物生态学报, 2008, 32(2):319-327.
doi: 10.3773/j.issn.1005-264x.2008.02.008 |
|
[ Guo Ni, Zhu Yanjun, Wang Jiemin, et al. The relationship between NDVI and climate elements for 22 years in different vegetation areas of Northwest China[J]. Journal of Plant Ecology, 2008, 32(2):319-327. ]
doi: 10.3773/j.issn.1005-264x.2008.02.008 |
|
| [42] | 曾佳, 郭峰, 赵灿, 等. 塔克拉玛干沙漠南缘小绿洲近50 a来气候变化特征[J]. 干旱区地理, 2014, 37(5):948-957. |
| [ Zeng Jia, Guo Feng, Zhao Can, et al. Climate change of small oases in the southern margin of Taklimakan Desert in recent 50 years[J]. Arid Land Geography, 2014, 37(5):948-957. ] | |
| [43] | 段峥嵘, 祖拜代·木依布拉, 夏建新. 基于NDVI 的干旱区绿洲植被覆盖度动态变化分析: 以新疆阿克苏地区为例[J]. 中央民族大学学报(自然科学版), 2018, 27(2):5-14. |
| [ Duan Zhengrong, Zubaidai Muyibula, Xia Jianxin. Analysis of vegetation coverage dynamic change in typical oasis of arid areas based on NDVI: A case study of Aksu region in Xinjiang[J]. Journal of MUC(Natural Sciences Edition), 2018, 27(2):5-14. ] | |
| [44] | 隋悦, 鹿琳琳, 张熙, 等. 2000—2013年新疆植被覆盖变化多尺度遥感分析[J]. 气象与环境科学, 2016, 39(3):1-8. |
| [ Sui Yue, Lu Linlin, Zhang Xi, et al. Multi-scale remote sensing analysis of vegetation cover changes from 2000 to 2013 in Xinjiang[J]. Meteorological and Environmental Sciences, 2016, 39(3):1-8. ] | |
| [45] | 马骅, 吕永龙, 邢颖, 等. 农户对禁牧政策的行为响应及其影响因素研究——以新疆策勒县为例[J]. 干旱区地理, 2006, 29(6):902-908. |
| [ Ma Hua, Lyu Yonglong, Xing Ying, et al. Rural households’ behavior responses to grazing prohibition policy: A case study in Qira, China[J]. Arid Land Geography, 2006, 29(6):902-908. ] | |
| [46] | 岳胜如, 周纪云, 胡雪菲, 等. 2000—2018年新疆植被覆盖时空变化特征及驱动力分析[J]. 塔里木大学学报, 2020, 32(2):97-105. |
| [ Yue Shengru, Zhou Jiyun, Hu Xuefei, et al. Study on driving factors and spatial-temporal evolution of vegetation coverage in Xinjiang from 2000 to 2018[J]. Journal of Tarim University, 2020, 32(2):97-105. ] |
| Viewed | ||||||||||||||||||||||||||||||||||||||||||||||||||
|
Full text 738
|
|
|||||||||||||||||||||||||||||||||||||||||||||||||
|
Abstract 689
|
|
|||||||||||||||||||||||||||||||||||||||||||||||||
Cited |
|
|||||||||||||||||||||||||||||||||||||||||||||||||
| Shared | ||||||||||||||||||||||||||||||||||||||||||||||||||
|
||