干旱区研究 ›› 2023, Vol. 40 ›› Issue (3): 469-480.doi: 10.13866/j.azr.2023.03.13
马晓蕾1,2( ),乔雅琦3,王婕3,焦士兴3,张曼3
收稿日期:2022-03-30
修回日期:2022-06-06
出版日期:2023-03-15
发布日期:2023-03-31
作者简介:马晓蕾(1989-),女,讲师,博士,研究方向为经济地理与区域可持续发展. E-mail: 基金资助:
MA Xiaolei1,2(),QIAO Yaqi3,WANG Jie3,JIAO Shixing3,ZHANG Man3
Received:2022-03-30
Revised:2022-06-06
Online:2023-03-15
Published:2023-03-31
摘要:
运用水生态足迹及其深度与广度评价方法,对2000—2019年陕西省水生态足迹、承载力、深度与广度时空格局进行研究。从经济、人口、环境、农业和水利5个方面,构建水生态足迹影响因素指标体系,采用CFEM模型对水生态足迹成因进行分析。结果表明:(1) 陕西省水生态足迹总体呈波动上升趋势,多年均值为1403×104 hm2,其中,农业水生态足迹占比最高,多年平均占比为66.65%,工业和居民生活水生态足迹占比分别为15.84%和13.39%;(2) 陕西省水生态承载力年际分配不均衡,在603.5×10⁴ hm2~3741×104 hm2间波动,多年均值为1632.9×104 hm2,高于水生态足迹,处于水生态盈余状态;(3) 近10 a,陕西省主要以消耗水资源流量资本为主,水生态足迹广度处于较高水平,但2001年和2016年,水资源存量资本消耗量大;(4) 陕西省水生态承载力与水生态足迹区域差异大,但年际变化相对较小;(5) 经济发展水平、人口和水库库容,对陕西省水生态足迹具有显著的正向影响。为加强陕西省水生态承载力,应进一步完善和巩固水利工程设施建设,增加水库库容,完善水资源管理制度,强化水资源刚性约束。
马晓蕾,乔雅琦,王婕,焦士兴,张曼. 陕西省水生态足迹深度与广度时空格局及影响因素[J]. 干旱区研究, 2023, 40(3): 469-480.
MA Xiaolei,QIAO Yaqi,WANG Jie,JIAO Shixing,ZHANG Man. The spatiotemporal patterns of water ecological footprints, depth, size, and influencing factors in Shaanxi Province[J]. Arid Zone Research, 2023, 40(3): 469-480.
表1
水生态足迹影响因素"
| 指标类型 | 指标名称 | ||
|---|---|---|---|
| 水生态足迹 | 经济指标 (换算为可比价) | 生产总值/109元 | |
| 地方一般公共预算收入/104元 | |||
| 城镇居民人均可支配收入/元 | |||
| 农村居民人均可支配收入/元 | |||
| 人口指标 | 常住人口/104人 | ||
| 环境指标 | 人均日生活用水量/L | ||
| 人均公园绿地面积/m2 | |||
| 农业指标 | 种植业 | 水田面积/103 hm2 | |
| 水浇地面积/103 hm2 | |||
| 单位面积粮食产量/(kg·hm-2) | |||
| 节水灌溉类机械/套 | |||
| 林业 | 荒山荒地造林面积/hm2 | ||
| 畜牧业 | 肉类总产量/t | ||
| 水利条件指标 | 水利建设投资总计/104元 | ||
| 节水灌溉面积/103 hm2 | |||
| 水库库容/104 m3 |
表2
陕西省各地市水资源产量因子值"
| 地区 | 2000年 | 2005年 | 2010年 | 2019年 |
|---|---|---|---|---|
| 西安 | 0.72 | 1.00 | 0.90 | 0.90 |
| 铜川 | 0.12 | 0.13 | 0.33 | 0.19 |
| 宝鸡 | 0.35 | 0.59 | 0.67 | 0.62 |
| 咸阳 | 0.16 | 0.15 | 0.21 | 0.18 |
| 渭南 | 0.28 | 0.28 | 0.32 | 0.26 |
| 延安 | 0.07 | 0.08 | 0.09 | 0.08 |
| 榆林 | 0.15 | 0.13 | 0.13 | 0.15 |
| 汉中 | 1.47 | 2.09 | 2.12 | 2.45 |
| 安康 | 1.28 | 2.00 | 1.90 | 1.86 |
| 商洛 | 0.75 | 0.93 | 1.13 | 0.60 |
| 平均值 | 0.53 | 0.74 | 0.78 | 0.73 |
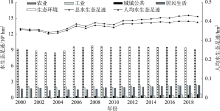
图1
2000—2019年陕西省水生态足迹变化趋势"
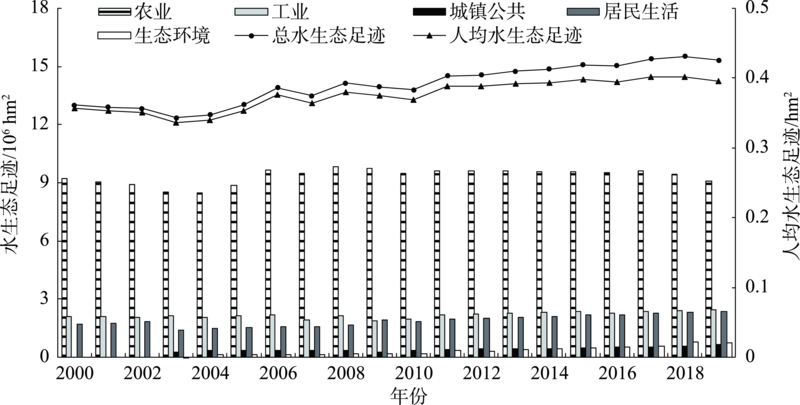
表3
2000—2019年陕西省水生态承载力与水生态盈亏指数变化"
 |

图2
2000—2019年陕西省水生态足迹广度与深度随时间变化"
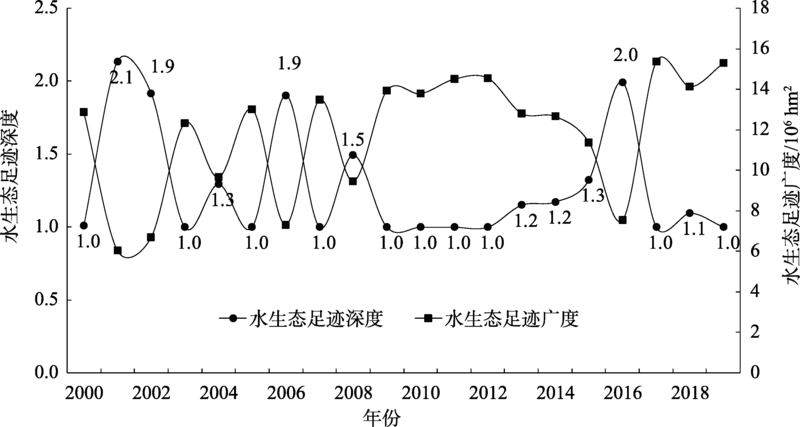
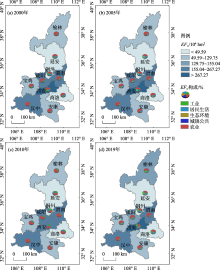
图3
陕西省水生态足迹及其构成时空演变 注:2000年缺少生态环境和城镇公共用水数据。"

表4
陕西省各地市人均EFw"
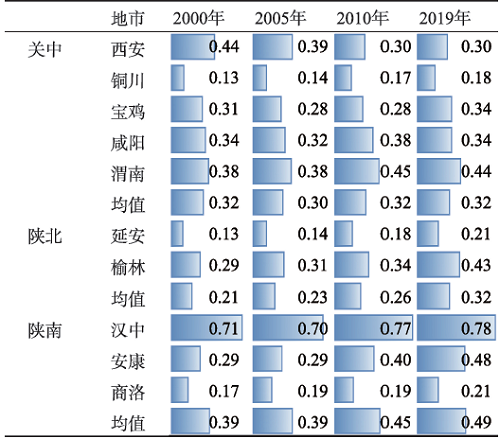 |
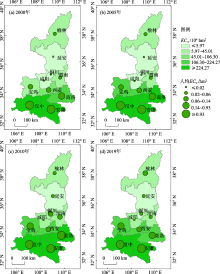
图4
陕西省水生态承载力时空演变"

表5
陕西省各地市水生态盈亏(EBw)总量及其人均情况"
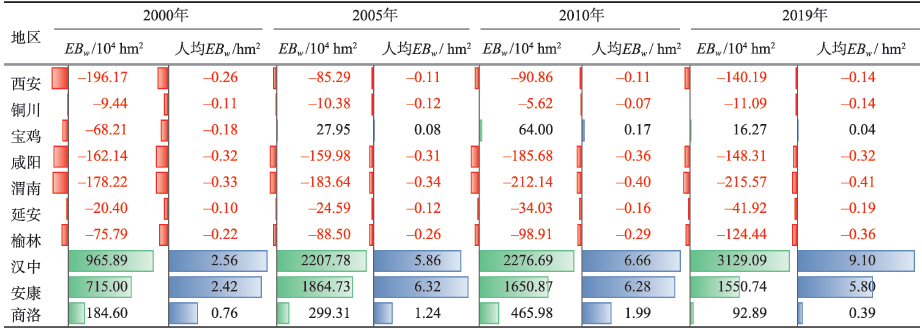 |
表6
陕西省各地市水生态足迹深度(EFwd)与广度(EFws)值变化"
| 城市 | EFws /104 hm2 | EFwd | |||||||
|---|---|---|---|---|---|---|---|---|---|
| 2000年 | 2005年 | 2010年 | 2019年 | 2000年 | 2005年 | 2010年 | 2019年 | ||
| 西安 | 106.30 | 205.44 | 166.66 | 170.55 | 2.85 | 1.42 | 1.55 | 1.82 | |
| 铜川 | 1.14 | 1.35 | 8.59 | 2.79 | 9.28 | 8.67 | 1.65 | 4.97 | |
| 宝鸡 | 45.01 | 103.80 | 104.13 | 129.75 | 2.52 | 1.00 | 1.00 | 1.00 | |
| 咸阳 | 5.13 | 4.48 | 9.19 | 6.73 | 32.58 | 36.73 | 21.20 | 23.04 | |
| 渭南 | 21.61 | 20.65 | 28.02 | 18.15 | 9.25 | 9.89 | 8.57 | 12.88 | |
| 延安 | 4.23 | 4.50 | 5.97 | 4.85 | 5.82 | 6.46 | 6.70 | 9.64 | |
| 榆林 | 19.58 | 16.13 | 15.46 | 21.51 | 4.87 | 6.49 | 7.40 | 6.78 | |
| 汉中 | 261.98 | 262.81 | 263.47 | 267.27 | 1.00 | 1.00 | 1.00 | 1.00 | |
| 安康 | 85.12 | 85.45 | 104.13 | 128.43 | 1.00 | 1.00 | 1.00 | 1.00 | |
| 商洛 | 39.67 | 44.79 | 44.79 | 49.59 | 1.00 | 1.00 | 1.00 | 1.00 | |
表7
陕西省各地市人均水足迹广度"
| 地区 | 2019年 水生态盈亏 | 2000年 | 2005年 | 2010年 | 2019年 |
|---|---|---|---|---|---|
| 西安 | 赤字 | 0.15 | 0.28 | 0.20 | 0.17 |
| 铜川 | 赤字 | 0.01 | 0.02 | 0.10 | 0.04 |
| 宝鸡 | 盈余 | 0.12 | 0.28 | 0.28 | 0.34 |
| 咸阳 | 赤字 | 0.01 | 0.01 | 0.02 | 0.01 |
| 渭南 | 赤字 | 0.04 | 0.04 | 0.05 | 0.03 |
| 延安 | 赤字 | 0.02 | 0.02 | 0.03 | 0.02 |
| 榆林 | 赤字 | 0.06 | 0.05 | 0.05 | 0.06 |
| 汉中 | 盈余 | 0.71 | 0.70 | 0.77 | 0.78 |
| 安康 | 盈余 | 0.29 | 0.29 | 0.40 | 0.48 |
| 商洛 | 盈余 | 0.17 | 0.19 | 0.19 | 0.21 |
| [1] | 陕西省水利厅. 陕西省水资源公报[R]. 西安: 陕西省水利厅, 2020. |
| [Shaanxi Province Department of Water Resources. Shaanxi Water Resources Bulletin[R]. Xi’an: Shaanxi Province Department of Water Resources, 2020.] | |
| [2] | 卢亚丽, 徐帅帅, 司保江, 等. 黄河流域九省(区)水资源环境承载力动态演变特征研究[J]. 人民黄河, 2021, 43(11): 103-108. |
| [Lu Yali, Xu Shuaishuai, Si Baojiang, et al. Study on dynamic evolution characteristics of water resources environmental carrying capacity of Nine Provinces and Regions of the Yellow River Basin[J]. Yellow River, 2021, 43(11): 103-108.] | |
| [3] |
卢亚丽, 徐帅帅, 沈镭. 基于胡焕庸线波动的长江经济带水资源环境承载力动态演变特征[J]. 自然资源学报, 2021, 36(11): 2811-2824.
doi: 10.31497/zrzyxb.20211107 |
|
[Lu Yali, Xu Shuaishuai, Shen Lei. The dynamic evolution of water resources environmental carrying capacity in the Yangtze River Economic Belt based on the fluctuation of Hu Line[J]. Journal of Natural Resources, 2021, 36(11): 2811-2824.]
doi: 10.31497/zrzyxb.20211107 |
|
| [4] | 郝帅, 孙才志, 宋强敏. 基于ESTDA模型的中国水生态足迹及水生态压力评价[J]. 生态学报, 2021, 41(12): 4651-4662. |
| [Hao Shuai, Sun Caizhi, Song Qiangmin. Evaluation of water ecological footprint and water ecological pressure based on ESTDA model in China[J]. Acta Ecologica Sinica, 2021, 41(12): 4651-4662.] | |
| [5] | 岳晨, 刘峰, 杨柳, 等. 北京市2010—2019年水资源生态足迹和生态承载力[J]. 水土保持通报, 2021, 41(3): 291-295. |
| [Yue Chen, Liu Feng, Yang Liu, et al. Ecological footprint and ecological carrying capacity of water resources in Beijing City during 2010-2019[J]. Bulletin of Soil and Water Conservation, 2021, 41(3): 291-295.] | |
| [6] | 李晓格, 张颖, 单永娟. 基于能值生态足迹模型的榆林市水资源可持续利用研究[J]. 干旱区研究, 2022, 39(4): 1066-1075. |
| [Li Xiaoge, Zhang Ying, Shan Yongjuan. Sustainable utilization of water resources in Yulin City based on an emergy ecological footprint model[J]. Arid Zone Research, 2022, 39(4): 1066-1075.] | |
| [7] |
Dai D, Sun M, Xu X, et al. Assessment of the water resource carrying capacity based on the ecological footprint: A case study in Zhangjiakou City, North China[J]. Environmental Science and Pollution Research, 2019, 26(11): 11000-11011.
doi: 10.1007/s11356-019-04414-9 |
| [8] |
Su Y, Gao W, Guan D, et al. Dynamic assessment and forecast of urban water ecological footprint based on exponential smoothing analysis[J]. Journal of Cleaner Production, 2018, 195: 354-364.
doi: 10.1016/j.jclepro.2018.05.184 |
| [9] | 熊鸿斌, 周银双. 基于三维水足迹-LMDI的安徽省水资源压力及驱动力分析[J]. 水土保持通报, 2019, 39(5): 194-203. |
| [Xiong Hongbin, Zhou Yinshuang. An analysis of water resources pressure and driving forces in Anhui Province based on LMDI-three-dimensional water footprint model[J]. Bulletin of Soil and Water Conservation, 2019, 39(5): 194-203.] | |
| [10] | 朱向梅, 王子莎. 黄河流域碳水足迹评价及时空格局研究[J]. 环境科学与技术, 2020, 43(10): 200-211. |
| [Zhu Xiangmei, Wang Zisha. Study on the assessment of carbon and water footprint and its spatial-temporal pattern in the Yellow River Basin[J]. Environmental Science &Technology, 2020, 43(10): 200-211.] | |
| [11] | 张倩, 谢世友. 基于水生态足迹模型的重庆市水资源可持续利用分析与评价[J]. 灌溉排水学报, 2019, 38(2): 93-100. |
| [Zhang Qian, Xie Shiyou. Using ecological water footprint model to analyze sustainable use of water resources in Chongqing[J]. Journal of Irrigation and Drainage, 2019, 38(2): 93-100.] | |
| [12] |
方恺. 生态足迹深度和广度: 构建三维模型的新指标[J]. 生态学报, 2013, 33(1): 267-274.
doi: 10.5846/stxb |
|
[Fang Kai. Ecological footprint depth and size: New indicators for a 3D model[J]. Acta Ecologica Sinica, 2013, 33(1): 267-274.]
doi: 10.5846/stxb |
|
| [13] | 李鹏辉, 徐丽萍, 刘笑, 等. 基于三维生态足迹模型的天山北麓绿洲生态安全评价[J]. 干旱区研究, 2020, 37(5): 1337-1345. |
| [Li Penghui, Xu Liping, Liu Xiao, et al. Ecological security evaluation of an oasis in the north of the Tianshan Mountains based on three-dimensional ecological footprint model[J]. Arid Zone Research, 2020, 37(5): 1337-1345.] | |
| [14] | 孙才志, 张智雄. 中国水生态足迹广度、深度评价及空间格局[J]. 生态学报, 2017, 37(21): 7048-7060. |
| [Sun Caizhi, Zhang Zhixiong. Assessment of water ecological footprint size, depth, and spatial pattern in China[J]. Acta Ecologica Sinica, 2017, 37(21): 7048-7060.] | |
| [15] |
Liang D, Lu H, Feng L, et al. Assessment of the sustainable utilization level of water resources in the wuhan metropolitan area based on a Three-dimensional water ecological footprint model[J]. Water, 2021, 13(24): 3505.
doi: 10.3390/w13243505 |
| [16] | 张义, 张合平, 李丰生, 等. 基于改进模型的广西水资源生态足迹动态分析[J]. 资源科学, 2013, 35(8): 1601-1610. |
| [Zhang Yi, Zhang Heping, Li Fengsheng, et al. Dynamic analysis of the water resource ecological footprint of Guangxi based on an improved mode[J]. Resources Science, 2013, 35(8): 1601-1610.] | |
| [17] | 莫崇勋, 赵梳坍, 阮俞理, 等. 基于生态足迹的广西壮族自治区水资源生态特征时空变化规律及其驱动因素分析[J]. 水土保持通报, 2020, 40(6): 297-302. |
| [Mo Chongxun, Zhao Shutan, Ruan Yuli, et al. Spatial-temporal variation of water ecological characteristics of Guangxi Zhuangzu Autonomous Region and its driving factors based on ecological footprint model[J]. Bulletin of Soil and Water Conservation, 2020, 40(6): 297-302.] | |
| [18] | 焦士兴, 王安周, 陈林芳, 等. 河南省水生态足迹测度及其驱动效应分析[J]. 水文, 2020, 40(1): 91-96. |
| [Jiao Shixing, Wang Anzhou, Chen Linfang, et al. Analysis of water ecological footprint and its driving effects in Henan Province[J]. Journal of China Hydrology, 2020, 40(1): 91-96.] | |
| [19] | 刘玉邦, 严雨男. 成都市水生态足迹的时间分布特征及其影响因素[J]. 南水北调与水利科技, 2020, 18(2): 93-98. |
| [Liu Yubang, Yan Yunan. An analysis of time distribution characteristics of water ecological footprint and its influencing factors in Chengdu City[J]. South-to-North Water Transfers and Water Science &Technology, 2020, 18(2): 93-98.] | |
| [20] | 贾陈忠, 乔扬源, 关格格, 等. 山西省水资源生态足迹时空变化特征及驱动因素[J]. 水土保持研究, 2019, 26(2): 370-376. |
| [Jia Chenzhong, Qiao Yangyuan, Guan Gege, et al. Temporal and spatial variations and the driving factors of water resources ecological footprint in Shanxi Province[J]. Research of Soil and Water Conservation, 2019, 26(2): 370-376.] | |
| [21] | 陈义忠, 乔友凤, 卢宏玮, 等. 长江中游城市群水-碳-生态足迹变化特征及其平衡性分析[J]. 生态学报, 2022, 42(4): 1368-1380. |
| [Chen Yizhong, Qiao Youfeng, Lu Hongwei, et al. Water-corbon-ecological footprint change characteristics and its balance analysis in the Triangle of Central China[J]. Acta Ecologica Sinica, 2022, 42(4): 1368-1380.] | |
| [22] | 黄林楠, 张伟新, 姜翠玲, 等. 水资源生态足迹计算方法[J]. 生态学报, 2008, 28(3): 1279-1286. |
| [Huang Linnan, Zhang Weixin, Jiang Cuiling, et al. Ecological footprint method in water resources assessment[J]. Acta Ecologica Sinica, 2008, 28(3): 1279-1286.] | |
| [23] | 王宁, 粟晓玲. 陕西关中地区水资源生态足迹与生态赤字研究[J]. 西北农林科技大学学报(自然科学版), 2013, 41(3): 221-227. |
| [Wang Ning, Su Xiaoling. Ecological footprint and deficit of water resources in Guanzhong, Shaanxi[J]. Journal of Northwest A & F University (Natural Science Edition), 2013, 41(3): 221-227.] | |
| [24] |
Wang H, Huang J, Zhou H, et al. Analysis of sustainable utilization of water resources based on the improved water resources ecological footprint model: A case study of Hubei Province, China[J]. Journal of Environmental Management, 2020, 262: 110331.
doi: 10.1016/j.jenvman.2020.110331 |
| [25] | 李菲, 张小平. 甘肃省水资源生态足迹和生态承载力时空特征[J]. 干旱区地理, 2020, 43(6): 1486-1495. |
| [Li Fei, Zhang Xiaoping. Spatio-temporal characteristics of Ecological footprint and ecological carrying capacity of water resources in Gansu Province[J]. Arid Land Geography, 2020, 43(6): 1486-1495.] | |
| [26] | 安慧, 范历娟, 吴海林, 等. 基于BP神经网络的淮河流域水生态足迹分析与预测[J]. 长江流域资源与环境, 2021, 30(5): 1076-1087. |
| [An Hui, Fan Lijuan, Wu Hailin, et al. Analysis and prediction of water ecological footprint of Huaihe river basin based on BP neural network[J]. Resources and Environment in the Yangtze Basin, 2021, 30(5): 1076-1087.] | |
| [27] |
Yang Y, Cai Z. Ecological security assessment of the Guanzhong Plain urban agglomeration based on an adapted ecological footprint model[J]. Journal of Cleaner Production, 2020, 260: 120973.
doi: 10.1016/j.jclepro.2020.120973 |
| [28] | 朱光磊, 赵春子, 朱卫红, 等. 基于生态足迹模型的吉林省水资源可持续利用评价[J]. 中国农业大学学报, 2020, 25(9): 131-143. |
| [Zhu Guanglei, Zhao Chunzi, Zhu Weihong, et al. Evaluation of sustainable water resources utilization in Jilin Province based on the ecological footprint model[J]. Journal of China Agricultural University, 2020, 25(9): 131-143.] | |
| [29] | 左其亭, 姜龙, 冯亚坤, 等. 黄河沿线省区水资源生态足迹时空特征分析[J]. 灌溉排水学报, 2020, 39(10): 1-8, 34. |
| [Zuo Qiting, Jiang Long, Feng Yakun, et al. Spatiotemporal variation of ecological footprint of water resources in the provinces in the Yellow river basin[J]. Journal of Irrigation and Drainage, 2020, 39(10): 1-8, 34.] | |
| [30] | 李雨欣, 薛东前, 宋永永. 中国水资源承载力时空变化与趋势预警[J]. 长江流域资源与环境, 2021, 30(7): 1574-1584. |
| [Li Yuxin, Xue Dongqian, Song Yongyong. Spatio-temporal characteristics and trend warnings of water resources carrying capacity in China[J]. Resources and Environment in the Yangtze Basin, 2021, 30(7): 1574-1584.] | |
| [31] |
王文国, 何明雄, 潘科, 等. 四川省水资源生态足迹与生态承载力的时空分析[J]. 自然资源学报, 2011, 26(9): 1555-1565.
doi: 10.11849/zrzyxb.2011.09.011 |
|
[Wang Wenguo, He Mingxiong, Pan Ke, et al. Analysis of spatio-temporal characteristics of water resources ecological footprint and ecological carrying capacity in Sichuan Province[J]. Journal of Natural Resources, 2011, 26(9): 1555-1565.]
doi: 10.11849/zrzyxb.2011.09.011 |
|
| [32] |
方恺, 高凯, 李焕承. 基于三维生态足迹模型优化的自然资本利用国际比较[J]. 地理研究, 2013, 32(9): 1657-1667.
doi: 10.11821/dlyj201309008 |
|
[Fang Kai, Gao Kai, Li Huancheng. International comparison of natural capital use: A three-dimensional model optimization of ecological footprint[J]. Geographical Research, 2013, 32(9): 1657-1667.]
doi: 10.11821/dlyj201309008 |
|
| [33] |
方恺, Heijungs Reinout. 自然资本核算的生态足迹三维模型研究进展[J]. 地理科学进展, 2012, 31(12): 1700-1707.
doi: 10.11820/dlkxjz.2012.12.016 |
|
[Fang Kai, Heijungs Reinout. A review on Three-dimensional ecological footprint model for natural capital accounting[J]. Progress in Geography, 2012, 31(12): 1700-1707.]
doi: 10.11820/dlkxjz.2012.12.016 |
|
| [34] | 方恺. 基于改进生态足迹三维模型的自然资本利用特征分析-选取11个国家为数据源[J]. 生态学报, 2015, 35(11): 3766-3777. |
| [Fang Kai. Assessing the natural capital use of eleven nations: An application of a revised three-dimensional model of ecological footprint[J]. Acta Ecologica Sinica, 2015, 35(11): 3766-3777.] | |
| [35] | 王周伟, 崔百胜, 张元庆. 空间计量经济学: 现代模型与方法[M]. 北京: 北京大学出版社, 2017: 195-266. |
| [Wang Zhouwei, Cui Baisheng, Zhang Yuanqing. Spatial Econometric: Modern Models and Methods[M]. Beijing: Peking University Press, 2017: 195-266.] |
| [1] | 刘军彦,王世杰. 基于ICESat-2卫星测高数据的呼伦湖水位变化监测[J]. 干旱区研究, 2023, 40(9): 1438-1445. |
| [2] | 海龙, 周梅, 张嘉開, 洪光宇, 李凤滋, 费菲. 毛乌素沙地不同林龄杨柴灌木林土壤呼吸及其影响因素[J]. 干旱区研究, 2023, 40(7): 1107-1116. |
| [3] | 齐润泽, 潘竟虎. 河湟地区生态脆弱性时空演变及影响因素研究[J]. 干旱区研究, 2023, 40(6): 1002-1013. |
| [4] | 董翰林, 王文婷, 谢云, 阿依达娜·叶斯那力, 江源天, 徐嘉淇. 新疆气候干湿变化特征及其影响因素[J]. 干旱区研究, 2023, 40(12): 1875-1884. |
| [5] | 贺军奇,拜寒伟,徐轶玮,倪莉莉. 陕西黄土区农田土壤主要养分特征及影响因素[J]. 干旱区研究, 2023, 40(12): 1907-1917. |
| [6] | 吴万民, 刘涛, 陈鑫. 西北干旱半干旱区NDVI季节性变化及其影响因素[J]. 干旱区研究, 2023, 40(12): 1969-1981. |
| [7] | 程红霞, 林粤江, 陈鹏, 梁凤超, 王勇. 塔里木盆地沙尘天气日数变化及影响因素[J]. 干旱区研究, 2023, 40(11): 1707-1717. |
| [8] | 党慧, 荣丽华, 李伊彤, 赵名君. 农牧交错区三生空间时空演变特征与影响因素——以内蒙古呼和浩特市为例[J]. 干旱区研究, 2023, 40(10): 1698-1706. |
| [9] | 郭茵,雷加强,范敬龙,王海峰,吕振涛. 近20 a蒙古国土壤风蚀变化特征及主要影响因素分析[J]. 干旱区研究, 2022, 39(4): 1200-1211. |
| [10] | 张云霞,张金茜,巩杰. 半干旱区湖盆景观格局脆弱性及其影响因素——以凉城县为例[J]. 干旱区研究, 2022, 39(4): 1259-1269. |
| [11] | 曹永香,毛东雷,薛杰,苏松领,开买尔古丽·阿不来提,蔡富艳. 绿洲-沙漠过渡带植被覆盖动态变化及其驱动因素——以新疆策勒为例[J]. 干旱区研究, 2022, 39(2): 510-521. |
| [12] | 王毓芳,赵成章,曾红霞,康满萍,赵婷婷,唐玉瑞. 疏勒河中游湿地景观时空演变及其影响因素[J]. 干旱区研究, 2022, 39(1): 282-291. |
| [13] | 王紫薇,黄来明,邵明安,裴艳武. 青海高寒区不同土地利用方式下土壤持水能力及影响因素[J]. 干旱区研究, 2021, 38(6): 1722-1730. |
| [14] | 王振,李均力,包安明,张久丹,白洁. 1995—2020年新疆巴里坤湖面积时序变化及归因[J]. 干旱区研究, 2021, 38(6): 1514-1523. |
| [15] | 杨贵森,黄磊,杨利贞,陈嘉嘉. 植物根系水力再分配量及影响因素分析[J]. 干旱区研究, 2021, 38(5): 1411-1419. |
|
||