Arid Zone Research ›› 2022, Vol. 39 ›› Issue (4): 1303-1311.doi: 10.13866/j.azr.2022.04.30
• Agricultural Ecology • Previous Articles Next Articles
LI Yuanhang1,2,3( ),HAO Xingming2,3(),ZHANG Jingjing2,3,4,FAN Xue1,2,3,ZHAO Zhuoyi2,3,4
Received:2021-12-10
Revised:2022-01-19
Online:2022-07-15
Published:2022-09-26
Contact:
Xingming HAO
E-mail:li18337672237@163.com;haoxm@ms.xjb.ac.cn
LI Yuanhang,HAO Xingming,ZHANG Jingjing,FAN Xue,ZHAO Zhuoyi. Spatial and temporal variation of net carbon sink function of farmland in Aksu oasis in the past 17 years[J].Arid Zone Research, 2022, 39(4): 1303-1311.
Add to citation manager EndNote|Reference Manager|ProCite|BibTeX|RefWorks
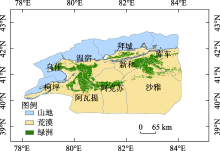
Fig. 1
Study area overview"

Tab. 1
Carbon emission factors for each type of carbon emission pathway"
| 碳排放途径 | 碳排放系数 | 来源 |
|---|---|---|
| 氮肥(A1) | 1740.00 kg·kg-1 | [ |
| 磷肥(A2) | 165.09 kg·kg-1 | [ |
| 钾肥(A3) | 120.28 kg·kg-1 | [ |
| 复合肥(A4) | 380.97 kg·kg-1 | [ |
| 农药(B) | 4.9341 kg·kg-1 | 美国橡树岭国家实验室 |
| 农膜(C) | 5.18 kg·kg-1 | 南京农业大学农业资源与生态环境研究所 |
| 农田耕作(D) | 16.47 kg·hm-2 | [ |
| 农业用电(F) | 0.18 kg·kW-1 | 政府间气候变化专门委员会 |
| 农业灌溉(G) | 266.48 kg·hm-2 | [ |
| 柴油(J) | 0.5927 g·kg-1 | 政府间气候变化专门委员会 |
| 农田翻耕(H) | 312.6 kg·hm-2 | [ |

Fig. 2
Interannual variation of NEP and monthly average variation of oasis in the study area"
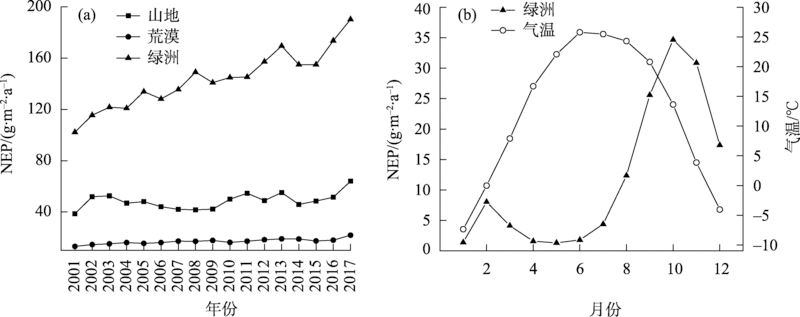
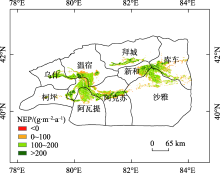
Fig. 3
Spatial distribution of annual average NEP on oasis farmland"

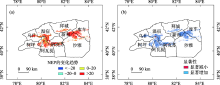
Fig. 4
Trends in NEP on oasis farmland, 2001-2017"

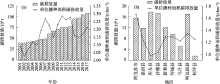
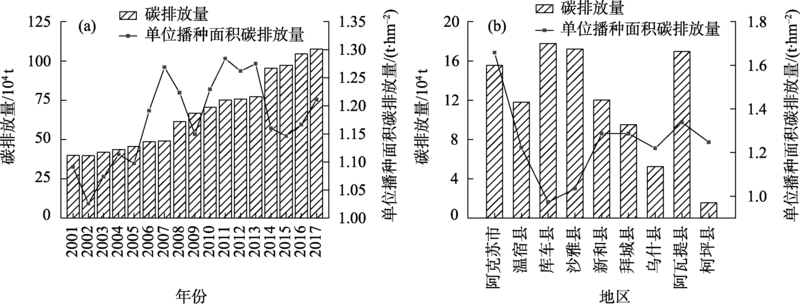
Fig. 5
Spatial and temporal variation of carbon emissions from oasis farmland"
Tab. 2
Carbon emissions from agricultural production inputs in oasis farmlands, 2001-2017 /104 t"
| 年份 | 化肥 | 农膜 | 农药 | 农机 | 灌溉 | 柴油 | 翻耕 | 总和 |
|---|---|---|---|---|---|---|---|---|
| 2001 | 9.70 | 0.23 | 6.95 | 11.46 | 9.03 | 1.99 | 0.58 | 39.94 |
| 2002 | 9.54 | 0.21 | 6.29 | 12.11 | 8.78 | 2.20 | 0.56 | 39.69 |
| 2003 | 11.01 | 0.22 | 6.52 | 12.21 | 8.80 | 2.56 | 0.55 | 41.88 |
| 2004 | 11.64 | 0.25 | 7.35 | 12.25 | 8.62 | 2.90 | 0.55 | 43.55 |
| 2005 | 12.33 | 0.26 | 7.79 | 13.03 | 8.73 | 2.93 | 0.58 | 45.64 |
| 2006 | 14.00 | 0.33 | 8.76 | 12.77 | 8.97 | 3.16 | 0.60 | 48.58 |
| 2007 | 14.66 | 0.34 | 9.29 | 12.13 | 9.25 | 2.82 | 0.62 | 49.12 |
| 2008 | 16.97 | 0.30 | 12.24 | 15.62 | 11.78 | 3.07 | 1.31 | 61.30 |
| 2009 | 18.60 | 0.48 | 12.88 | 18.10 | 12.09 | 3.66 | 0.90 | 66.71 |
| 2010 | 20.00 | 0.53 | 14.13 | 17.89 | 13.04 | 4.01 | 0.94 | 70.55 |
| 2011 | 22.46 | 0.49 | 15.02 | 18.24 | 13.60 | 4.49 | 0.84 | 75.14 |
| 2012 | 21.95 | 0.50 | 15.32 | 18.72 | 13.49 | 4.82 | 0.94 | 75.73 |
| 2013 | 22.35 | 0.52 | 15.60 | 18.89 | 13.73 | 5.17 | 0.94 | 77.20 |
| 2014 | 26.24 | 0.63 | 19.89 | 25.62 | 15.88 | 6.05 | 1.01 | 95.32 |
| 2015 | 26.48 | 0.63 | 20.50 | 26.45 | 15.77 | 6.41 | 0.98 | 97.23 |
| 2016 | 29.41 | 1.18 | 21.26 | 27.70 | 17.49 | 6.57 | 0.95 | 104.56 |
| 2017 | 31.97 | 0.16 | 21.47 | 27.70 | 18.21 | 6.20 | 1.01 | 106.73 |

Fig. 6
Interannual variation in net carbon sink of oasis farmland"
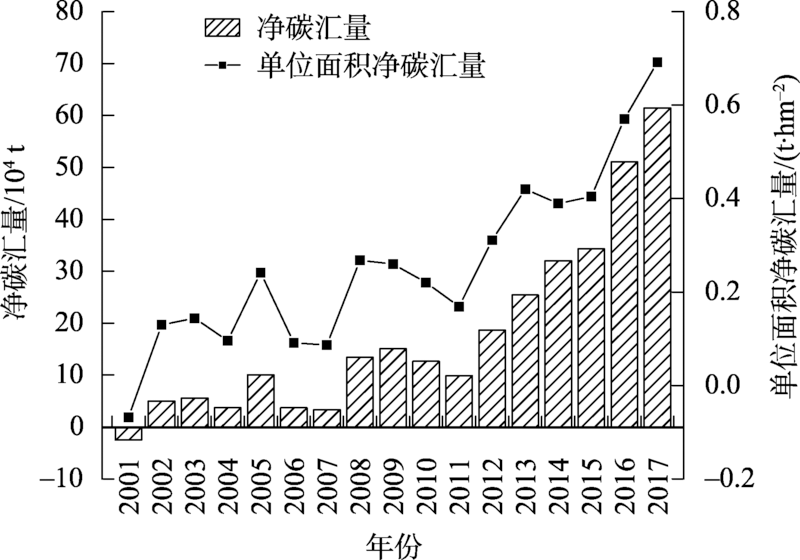
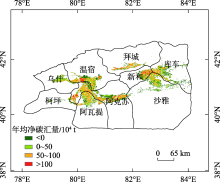
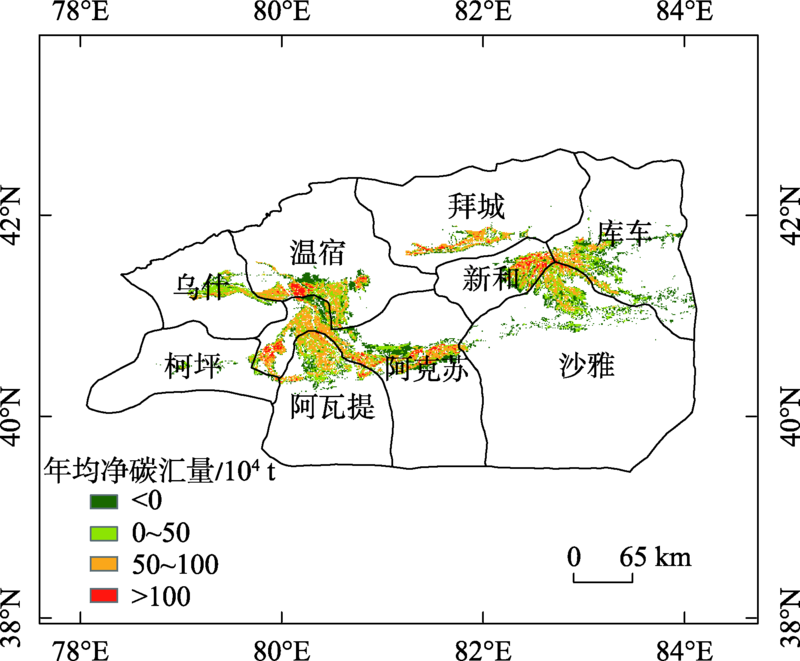
Fig. 7
Spatial distribution of the annual average net carbon sink of oasis farmland"
| [1] | Alexander L V, Allen S K, Bindoff N L, et al. Climate Change 2013: The Physical Science Basis, Contribution of Working Group I (WGI) to the Fifth Assessment Report (AR5) of the Intergovernmental Panel on Climate Change (IPCC)[M]. The United Kingdom: Cambridge University Press, 2013. |
| [2] | 张志强, 曲建升, 曾静静. 温室气体排放评价指标及其定量分析[J]. 地理学报, 2008, 63(7): 693-702. |
| [Zhang Zhiqiang, Qu Jiansheng, Zeng Jingjing. A quantitative comparison and analytical study on the assessment indicators of greenhouse gases emissions[J]. Acta Geographica Sinica, 2008, 63(7): 693-702.] | |
| [3] | 黄晓敏, 陈长青, 陈铭洲, 等. 2004—2013年东北三省主要粮食作物生产碳足迹[J]. 应用生态学报, 2016, 27(10): 3307-3315. |
| [Huang Xiaomin, Chen Changqing, Chen Mingzhou, et al. Carbon footprints of major stapie grain crops production in three provinces of Northeast China during 2004-2013[J]. Chinese Journal of Applied Ecology, 2016, 27(10): 3307-3315.] | |
| [4] |
刘宇峰, 原志华, 郭玲霞, 等. 中国农作物生产碳足迹及其空间分布特征[J]. 应用生态学报, 2017, 28(8): 2577-2587.
doi: 10.13287/j.1001-9332.201708.004 |
|
[Liu Yufeng, Yuan Zhihua, Guo Lingxia, et al. Carbon footprint of crop production in China from 1993 to 2013 and its spatial distribution[J]. Chinese Journal of Applied Ecology, 2017, 28(8): 2577-2587.]
doi: 10.13287/j.1001-9332.201708.004 |
|
| [5] | 冉光和, 王建洪, 王定祥. 我国现代农业生产的碳排放变动趋势研究[J]. 农业经济问题, 2011, 32(2): 32-38. |
| [Ran Guanghe, Wang Jianhong, Wang Dingxiang. Study on the changing tendency and counter-measures of carbon emission produced by agricultural production in China[J]. Issues in Agricultural Economy, 2011, 32(2): 32-38.] | |
| [6] | 张扬, 朱高峰, 秦文华, 等. 西北干旱区绿洲葡萄园净碳交换及其影响因素[J]. 干旱区研究, 2021, 38(3): 833-842. |
| [Zhang Yang, Zhu Gaofeng, Qin Wenhua, et al. Net carbon exchange and its influencing factors of the oasis vineyard in China’s Northwest arid region[J]. Arid Zone Research, 2021, 38(3): 833-842.] | |
| [7] | 陈罗烨, 薛领, 雪燕. 中国农业净碳汇时空演化特征分析[J]. 自然资源学报, 2016, 31(4): 596-607. |
| [Chen Luoye, Xue Ling, Xue Yan. Spatial-temporal characteristics of China’s agricultural net carbon sink[J]. Journal of Natural Resources, 2016, 31(4): 596-607.] | |
| [8] | 张赫, 彭千芮, 王睿, 等. 中国县域碳汇时空格局及影响因素[J]. 生态学报, 2020, 40(24): 8988-8998. |
| [Zhang He, Peng Qianrui, Wang Rui, et al. Spatiotemporal pattern sand factors influencing county carbon sinks in China[J]. Acta Ecologica Sinica, 2020, 40(24): 8988-8998.] | |
| [9] | 吕斯涵, 张小平. 山东省农业净碳汇时空演化特征分析[J]. 水土保持学报, 2019, 33(2): 227-234. |
| [Lyu Sihan, Zhang Xiaoping. Spatial-temporal characteristics of agri cultural net carbon sink in Shandong Province[J]. Journal of Soil and Water Conservation, 2019, 33(2): 227-234.] | |
| [10] | 许志平, 邵天杰, 张连凯, 等. 黄土区不同土地利用类型下砂质壤土地表CO2通量变化特征——以清凉寺沟流域为例[J]. 干旱区研究, 2021, 38(4): 1000-1009. |
| [Xu Zhiping, Shao Tianjie, Zhang Liankai, et al. Study on the change of surface CO2 flux in sandy loamy soil under different land use types: An example from the Qingliangsi ditch watershed[J]. Arid Zone Research, 2021, 38(4): 1000-1009.] | |
| [11] | Li J, Guo X, Chuai X, et al. Reexamine China’s terrestrial ecosystem carbon balance under land use-type and climate change[J]. Land Use Policy, 2021, 102(9): 196-204. |
| [12] | 徐虎, 蔡岸冬, 周怀平, 等. 长期秸秆还田显著降低褐土底层有机碳储量[J]. 植物营养与肥料学报, 2021, 27(5): 768-776. |
| [Xu Hu, Cai Andong, Zhou Huaiping, et al. Long-term straw incorporation significantly reduced subsoil organic carbon stock in cinnamon soil[J]. Plant Nutrition and Fertilizer Science, 2021, 27(5): 768-776.] | |
| [13] | 任凤玲. 不同施肥下我国典型农田土壤有机碳固定特征及驱动因素[D]. 北京: 中国农业科学院, 2021. |
| [Ren Fengling. Soil Carbon Sequestration and Its Driving Factors under Different Fertilization in Arable Land of China[D]. Beijing: Chinese Academy of Agricultural Sciences Thesis, 2021.] | |
| [14] |
朴世龙, 何悦, 王旭辉. 中国陆地生态系统碳汇估算: 方法、进展、展望[J]. 中国科学: 地球科学, 2022, 52(6): 1010-1020.
doi: 10.1360/SSTe-2021-0197 |
|
[Piao Shilong, He Yue, Wang Xuhui. Estimation of China’s terrestrial ecosystem carbon sink: Methods, progress and prospects[J]. Scientia Sinica Terrae, 2022, 52(6): 1010-1020.]
doi: 10.1360/SSTe-2021-0197 |
|
| [15] | 颜学斌, 王俊, 王科锋, 等. 基于DNDC模型模拟的冬小麦田土壤有机碳和作物产量对地表覆盖的响应[J]. 干旱地区农业研究, 2022, 40(1): 42-49. |
| [Yan Xuebin, Wang Jun, Wang Kefeng, et al. Responses of soil organic carbon and crop yield to surface mulching with straw and plastic film in winter wheat field using DNDC model[J]. Agricultural Research in the Arid Areas, 2022, 40(1): 42-49.] | |
| [16] | 张宝成, 白艳芬, 王加真, 等. 1990—2014年贵州农田生态系统碳汇变化[J]. 贵州农业科学, 2018, 46(4): 148-151. |
| [Zhang Baocheng, Bai Yanfen, Wang Jiazhen, et al. Variation of carbon sink in farmland ecosystem in Guizhou during 1990-2014[J]. Guizhou Agricultural Sciences, 2018, 46(4): 148-151.] | |
| [17] | 朱燕茹, 王梁. 农田生态系统碳源/碳汇综述[J]. 天津农业科学, 2019, 25(3): 27-32. |
| [Zhu Yanru, Wang Liang. A review of carbon source and carbon sink in farmland ecosystem[J]. Tianjin Agricultural Science, 2019, 25(3): 27-32.] | |
| [18] | 段华平, 张悦, 赵建波, 等. 中国农田生态系统的碳足迹分析[J]. 水土保持学报, 2011, 25(5): 203-208. |
| [Duan Huaping, Zhang Yue, Zhao Jianbo, et al. Carbon footprint analysis of farmland ecosystem in China[J]. Journal of Soil and Water Conservation, 2011, 25(5): 203-208.] | |
| [19] | 王梁, 赵杰, 陈守越. 山东省农田生态系统碳源、碳汇及其碳足迹变化分析[J]. 中国农业大学学报, 2016, 21(7): 133-141. |
| [Wang Liang, Zhao Jie, Chen Shouyue. Analysis of ecosystem carbon sources/sinks and carbon footprint in farmland ecosystem of Shandong Province[J]. Journal of China Agricultural University, 2016, 21(7): 133-141.] | |
| [20] |
黄端, 闫慧敏, 池泓, 等. 2000—2015年江汉平原农田生态系统NPP时空变化特征[J]. 自然资源学报, 2020, 35(4): 845-856.
doi: 10.31497/zrzyxb.20200408 |
|
[Huang Duan, Yan Huimin, Chi Hong, et al. Research on spatiotemporal characteristics of farmland ecosystem NPP in Jianghan Plain from 2000 to 2015[J]. Journal of Natural Resources, 2020, 35(4): 845-856.]
doi: 10.31497/zrzyxb.20200408 |
|
| [21] |
Nayak R K, Mishra N, Dadhwal V K, et al. Assessing the consistency between AVHRR and MODIS NDVI datasets for estimating terrestrial net primary productivity over India[J]. Journal of Earth System Science, 2016, 125(6): 1-16.
doi: 10.1007/s12040-015-0643-0 |
| [22] |
Qi X, Li Q, Yue Y, et al. Ruralurban migration and conservation drive the ecosystem services improvement in China Karst: A case study of Huanjiang County, Guangxi[J]. Remote Sensing, 2021, 13(4): 566.
doi: 10.3390/rs13040566 |
| [23] | 胡延斌, 肖国举, 仇正跻, 等. 西北半干旱区农田土壤有机碳和全氮分布特征及其对地膜玉米产量的影响[J]. 水土保持研究, 2021, 28(1): 58-64. |
| [Hu Yanbin, Xiao Guoju, Qiu Zhengji, et al. Distribution characteristics of soil organic carbon and total nitrogen and its influence on film-mulched maize in farmland in Northwest semiarid region[J]. Research of Soil and Water Conservation, 2021, 28(1): 58-64.] | |
| [24] | 叶文伟, 王城城, 赵从举, 等. 近20年海南岛热带农田生态系统碳足迹时空格局演变[J]. 中国农业资源与区划, 2021, 42(10): 114-126. |
| [Ye Wenwei, Wang Chengcheng, Zhao Congju, et al. Spatial and temporal evolution of carbon footprint of tropical farmland ecosystem in Hainan Island in recent 20 years[J]. Chinese Journal of Agricultural Resources and Regional Planning, 2021, 42(10): 114-126.] | |
| [25] | 俞永祥. 干旱区绿洲棉田土壤CO2/N2O排放特征及减排潜力研究[D]. 北京: 中国科学院大学, 2017. |
| [Yu Yongxiang. Study on the Characters of Soil CO2/N2O Emissions and Its Potential Mitigation in an Oasis Cotton Field in Arid Region of China[D]. Beijing: University of Chinese Academy of Sciences Physical Geography, 2017.] | |
| [26] | 李思诺, 翁白莎, 严登明, 等. SPI和SPEI在阿克苏河流域的适用性分析[J]. 水资源与水工程学报, 2016, 27(1): 101-107. |
| [Li Sinuo, Weng Baisha, Yan Dengming, et al. Applicability analysis of SPI and SPEI in Aksu River basin[J]. Journal of Water Resources and Water Engineering, 2016, 27(1): 101-107.] | |
| [27] | 张梅, 黄贤金, 揣小伟, 等. 中国净生态系统生产力空间分布及变化趋势研究[J]. 地理与地理信息科学, 2020, 36(2): 69-74. |
| [Zhang Mei, Huang Xianjin, Chuai Xiaowei, et al. Spatial distribution and changing trends of net ecosystem productivity in China[J]. Geography and Geo-Information Science, 2020, 36(2): 69-74.] | |
| [28] | 朱文泉, 潘耀忠, 龙中华, 等. 基于GIS和RS的区域陆地植被NPP估算——以中国内蒙古为例[J]. 遥感学报, 2005, 9(3): 300-307. |
| [Zhu Wenquan, Pan Yaozhong, Long Zhonghua, et al. Estimating net primary productivity of terrestrial vegetation based on GIS and RS: A case study in Inner Mongolia, China[J]. National Remote Sensing Bulletin, 2007, 9(3): 300-307.] | |
| [29] | 裴志永, 周才平, 欧阳华, 等. 青藏高原高寒草原区域碳估测[J]. 地理研究, 2010, 29(1): 102-110. |
| [Pei Zhiyong, Zhou Caiping, Ouyang Hua, et al. A carbon budget of alpine steppe area in the Tibetan Plateau[J]. Geographical Research, 2010, 29(1): 102-110.] | |
| [30] | 潘竟虎, 文岩. 中国西北干旱区植被碳汇估算及其时空格局[J]. 生态学报, 2015, 35(23): 7718-7728. |
| [Pan Jinghu, Wen Yan. Estimation and spatial-temporal characteristics of carbon sink in the arid regionof Northwest China[J]. Acta Ecologica Sinica, 2015, 35(23): 7718-7728.] | |
| [31] |
逯非, 王效科, 韩冰, 等. 中国农田施用化学氮肥的固碳潜力及其有效性评价[J]. 应用生态学报, 2008, 19(10): 2239-2250.
pmid: 19123362 |
|
[Lu Fei, Wang Xiaoke, Han Bing, et al. Assessment on the availability of nitrogen fertilization in improving carbon sequestration potential of China’s cropland soil[J]. Chinese Journal of Applied Ecology, 2008, 19(10): 2239-2250.]
pmid: 19123362 |
|
| [32] |
West T O, Marland G. A synthesis of carbon sequestration, carbon emissions, and net carbon flux in agriculture: Comparing tillage practices in the United States[J]. Agriculture Ecosystems & Environment, 2002, 91(1-3): 217-232.
doi: 10.1016/S0167-8809(01)00233-X |
| [33] | 伍芬琳, 李琳, 张海林, 等. 保护性耕作对农田生态系统净碳释放量的影响[J]. 生态学杂志, 2007, 26(12): 2035-2039. |
| [Wu Fenlin, Li Lin, Zhang Hailin, et al. Effects of conservation tillage on net carbon flux from farmland ecosystems[J]. Chinese Journal of Ecology, 2007, 26(12): 2035-2039.] | |
| [34] |
Zhang J, Hao X, Hao H, et al. Climate change decreased net ecosystem productivity in the arid region of Central Asia[J]. Remote Sensing, 2021, 13(21): 4449.
doi: 10.3390/rs13214449 |
| [35] | 徐春华, 张华, 马瑞芬. 石羊河上游净生态系统生产力研究[J]. 干旱区研究, 2015, 32(5): 1039-1045. |
| [Xu Chunhua, Zhang Hua, Ma Ruifen. On the net ecosystem productivity in the upper reaches area of Shiyang River[J]. Arid Zone Research, 2015, 32(5): 1039-1045.] | |
| [36] |
Li Z, Chen Y, Zhang Q F, et al. Spatial patterns of vegetation carbon sinks and sources dataset in Central Asia[J]. Data in Brief, 2020, 32: 106200.
doi: 10.1016/j.dib.2020.106200 |
| [1] | SUN Maosen,WANG Ranghui,NING Husen. Construction of the ecological network in the Aksu River Basin [J]. Arid Zone Research, 2023, 40(9): 1509-1516. |
| [2] | JI Mingxin, FENG Tianjiao, XIAO Huijie, XIN Zhiming, LI Junran, WANG Dong. Effects of different farmland shelterbelts on soil water and nutrient storage in the Hetao Irrigation District [J]. Arid Zone Research, 2023, 40(8): 1268-1279. |
| [3] | ZOU Yi, MENG Jijun. Evaluation of an oasis-urban-desert landscape and the related eco-environmental effects in an arid area [J]. Arid Zone Research, 2023, 40(6): 988-1001. |
| [4] | WEI Yajuan, DANG Xiaohong, WANG Ji, HAN Yanlong, XIE Yunhu, LIN Bo. Morphological characteristics of Nitraria tangutorum nebkhas in Jilantai desert-oasis ecotone [J]. Arid Zone Research, 2023, 40(3): 403-411. |
| [5] | HE Chenchen,WU Yingying,TIAN Yongsheng,MA Rui,WANG Zhenting. Variation characteristics of width-height ratio and migration speed of barchans at the margin of Minqin oasis [J]. Arid Zone Research, 2023, 40(2): 280-291. |
| [6] | HOU Wenbing, LI Kaiming, HUANG Zhuo. Characterization of spatial and temporal changes in the oasis effect and attribution analysis of the Hexi region in the last 20 years [J]. Arid Zone Research, 2023, 40(12): 2031-2042. |
| [7] | JIANG Lei,ZHAO Yi,ZHANG Pengwei,HE Liang,BAI Xiang. Study on influence degree of phreatic evaporation based on hydrogen and oxygen isotope characteristics [J]. Arid Zone Research, 2022, 39(6): 1793-1800. |
| [8] | FANG He,YAN Peiwen,SHI Jian,KANG Juan,LIU Hairong,CHEN Dan,LUO Ji,XU Dong. Temporal and spatial variation of vegetation ecological quality and its driving mechanism in Aksu prefecture [J]. Arid Zone Research, 2022, 39(6): 1907-1916. |
| [9] | HUANG Zhou,YANG Guang,SU Jun,LI Xiaolong,LIU Bing,HE Xinlin,QIAO Changlu,LI Pengfei,WANG Chunxia,ZHAO Li. Soil quality evaluation of returning farmland to Manas River irrigation area under the constraints of the“Three Red Lines” strategy of water resources [J]. Arid Zone Research, 2022, 39(6): 1942-1951. |
| [10] | AN Bin,XIAO Weiwei,ZHU Ni,LIU Yufeng. Temporal and spatial variations of precipitation concentration degree and precipitation concentration period on the Loess Plateau from 1960 to 2019 [J]. Arid Zone Research, 2022, 39(5): 1333-1344. |
| [11] | LONG Zhi,SUN Yingqi,LANG Lixia,CHEN Xingpeng,ZHANG Zilong,PANG Jiaxing. Spatiotemporal patterns and characteristics of carbon emissions in the Loess Plateau: A case study of Qingcheng County [J]. Arid Zone Research, 2022, 39(5): 1631-1641. |
| [12] | YE Xiaojuan,WANG Yonghui,PAN Hongzhong,BAI Yu,DONG Defu,YAO Huaming. Spatial-temporal variation and driving factors of vegetation net ecosystem productivity in Qinghai Province [J]. Arid Zone Research, 2022, 39(5): 1673-1683. |
| [13] | FU Dongsheng,REN Xiaomeng,WANG Yanling,ZHANG Cuiying,MENG Zhongju. Distribution characteristics of soil particle size in farming-pastoral ecotone: A case study of Wuchuan County in Inner Mongolia [J]. Arid Zone Research, 2022, 39(4): 1322-1332. |
| [14] | CAO Yongxiang,MAO Donglei,Xue Jie,SU Songling,Kaimaierguli Abulaiti,CAI Fuyan. Dynamic changes and driving factors of vegetation cover in the oasis-desert ecotone: A case study of Cele, Xinjiang [J]. Arid Zone Research, 2022, 39(2): 510-521. |
| [15] | WANG Xuyang,LI Dianpeng,SUN Tao,SUN Xia,JIA Hongtao,LI Jun,LI Xinhu. Effects of soil mulching on the greenhouse gas emissions of crops farmland in an arid area of Xinjiang [J]. Arid Zone Research, 2022, 39(1): 176-184. |
|
||