干旱区研究 ›› 2021, Vol. 38 ›› Issue (4): 1172-1183.doi: 10.13866/j.azr.2021.04.29 cstr: 32277.14.AZR.20210429
高宇婷1,2,3( ),于洋1,2,3(),孙凌霄1,3,于瑞德1,3,4
收稿日期:2020-09-14
修回日期:2021-02-21
出版日期:2021-07-15
发布日期:2021-08-03
作者简介:高宇婷(1995-),女,硕士研究生,研究方向为干旱区水文. E-mail: 基金资助:
GAO Yuting1,2,3(),YU Yang1,2,3(),SUN Lingxiao1,3,YU Ruide1,3,4
Received:2020-09-14
Revised:2021-02-21
Published:2021-07-15
Online:2021-08-03
摘要:
以塔里木盆地南缘的策勒绿洲为研究区,基于4期土地利用和遥感影像、以及气象、水文和社会经济数据,分析了1990—2018年策勒绿洲土地利用/覆被变化特征。结果表明:(1) 策勒绿洲各土地利用类型发生明显转变,农田面积向四周扩增,林地分布区域发生大幅度转移,不同覆盖程度的草地之间转化频繁。(2) 绿洲共有138.41 km2的面积发生转变,占总面积的53.85%,各类型的单一动态度依次为:高覆盖草地>农田>低覆盖草地>建设用地>中覆盖草地>未利用土地>林地,双向动态度依次为:高覆盖草地>农田>低覆盖草地>建设用地>林地>中覆盖草地>未利用土地。(3) 绿洲林草植被指数低于0,表明林地和草地一直处于退化的状态;绿洲土地利用变化驱动力主要为人口、降水以及径流量。
高宇婷,于洋,孙凌霄,于瑞德. 塔里木盆地南缘绿洲土地覆盖变化及驱动力[J]. 干旱区研究, 2021, 38(4): 1172-1183.
GAO Yuting,YU Yang,SUN Lingxiao,YU Ruide. Land coverage change and driving forces of an oasis in the southern margin of Tarim Basin[J]. Arid Zone Research, 2021, 38(4): 1172-1183.

图1
策勒绿洲位置示意图"
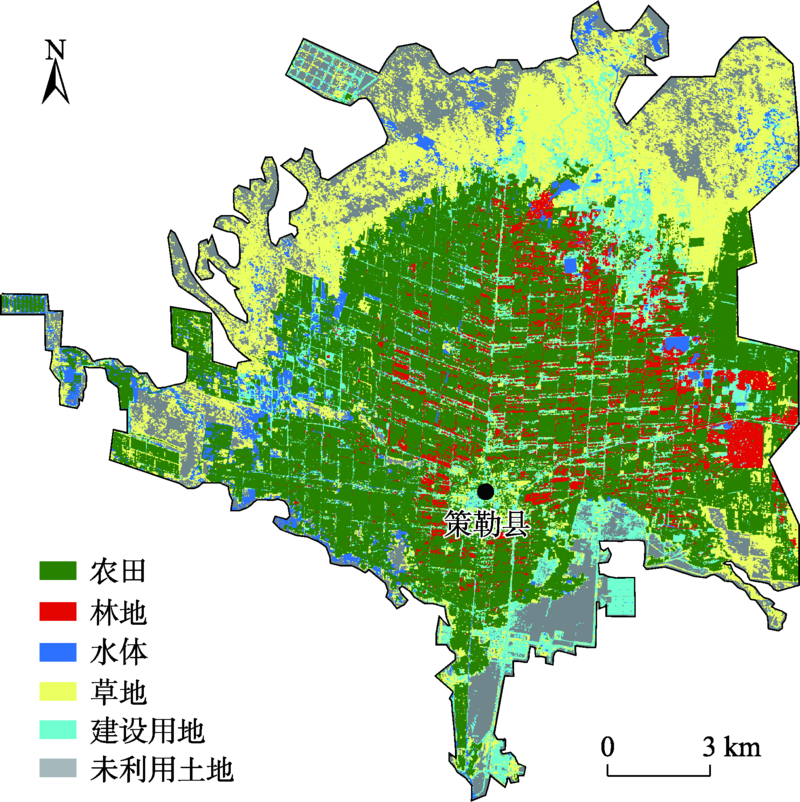
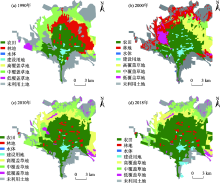
图2
策勒绿洲4期土地利用分布情况"
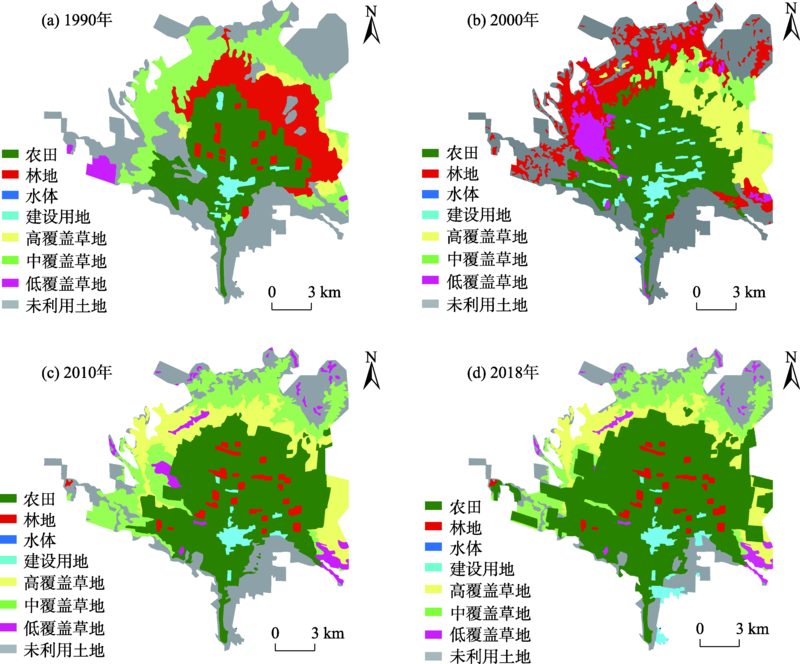
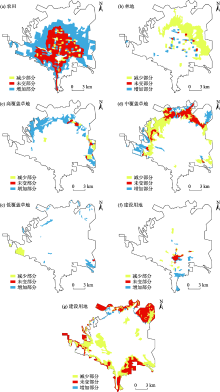
图3
策勒绿洲土地利用类型的空间变化"

表1
1990—2018年策勒绿洲土地利用转移矩阵"
| 土地利用类型 | 农田 | 林地 | 高覆盖植被 | 中覆盖植被 | 低覆盖植被 | 建设用地 | 未利用土地 | 总计 |
|---|---|---|---|---|---|---|---|---|
| 农田 | 56.55 | 5.02 | 0.24 | 0.02 | 1.68 | 0.10 | 63.61 | |
| 林地 | 33.56 | 1.24 | 7.05 | 1.45 | 0.02 | 0.13 | 0.05 | 43.50 |
| 高覆盖植被 | 4.20 | 2.32 | 0.62 | 7.15 | ||||
| 中覆盖植被 | 12.75 | 16.04 | 17.79 | 1.38 | 2.55 | 50.51 | ||
| 低覆盖植被 | 1.58 | 0.00 | 1.82 | 0.21 | 0.13 | 3.74 | ||
| 建设用地 | 2.62 | 0.37 | 2.41 | 5.40 | ||||
| 未利用土地 | 23.15 | 0.22 | 2.36 | 11.19 | 4.58 | 3.52 | 38.09 | 83.11 |
| 总计 | 134.41 | 6.84 | 27.78 | 33.11 | 6.21 | 7.75 | 40.92 | 257.02 |
表2
1990—2018年策勒绿洲土地利用动态变化率"
| 土地利用 类型 | 1990—2000年 | 2000—2010年 | 2010—2018年 | 1990—2018年 | ||||||||
|---|---|---|---|---|---|---|---|---|---|---|---|---|
| 变化 面积/km2 | 单一动 态度/% | 双向动 态度/% | 变化 面积/km2 | 单一动 态度/% | 双向动 态度/% | 变化 面积/km2 | 单一动 态度/% | 双向动 态度/% | 变化 面积/km2 | 单一动 态度/% | 双向动态度/% | |
| 农田 | 15.62 | 2.46 | 4.55 | 28.16 | 3.56 | 6.11 | 27.07 | 3.15 | 3.32 | 70.84 | 3.98 | 10.41 |
| 林地 | 4.92 | 1.13 | 18.30 | -41.55 | -8.59 | 12.78 | 0.01 | 0.01 | 0.90 | -36.62 | -3.01 | 3.93 |
| 高覆盖植被 | 22.18 | 31.05 | 40.62 | 8.96 | 3.06 | 14.95 | -10.50 | -3.43 | 3.74 | 20.64 | 10.32 | 15.14 |
| 中覆盖植被 | -40.00 | -7.93 | 10.17 | 31.16 | 29.75 | 44.99 | -8.53 | -2.56 | 2.96 | -17.37 | -1.23 | 3.40 |
| 低覆盖植被 | 7.14 | 19.10 | 38.10 | -2.93 | -2.69 | 13.50 | -1.74 | -2.73 | 3.57 | 2.47 | 2.36 | 9.10 |
| 建设用地 | 2.69 | 5.00 | 16.19 | -3.70 | -4.57 | 9.50 | 3.37 | 9.59 | 10.25 | 2.36 | 1.56 | 5.52 |
| 未利用土地 | -12.64 | -1.52 | 4.09 | -19.75 | -2.81 | 3.35 | -9.73 | -2.40 | 2.68 | -42.12 | -1.81 | 2.06 |

图4
1990—2018年策勒绿洲NDVI平均值分布(a)和NDVI差值变化(b)"
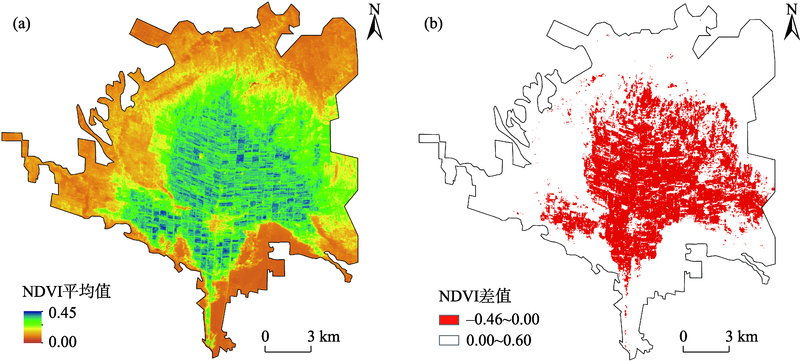
图5
各驱动因素变化趋势"
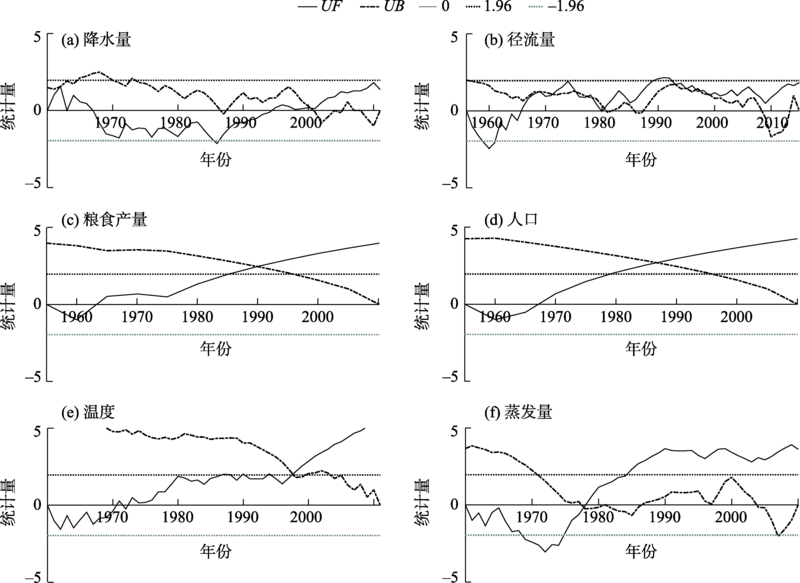
表3
土地覆被变化驱动因子主成分分析"
| 因素 | 第一主成分 | 第二主成分 | 第三主成分 | 第四主成分 | 第五主成分 |
|---|---|---|---|---|---|
| 径流量 | 0.448 | 0.312 | -0.203 | -0.168 | -0.752 |
| 气温 | 0.290 | 0.692 | 0.344 | 0.512 | 0.221 |
| 降水 | 0.440 | 0.043 | 0.411 | -0.727 | 0.326 |
| 蒸发量 | -0.325 | 0.598 | -0.569 | -0.369 | 0.246 |
| 人口 | 0.451 | -0.172 | -0.479 | 0.190 | 0.468 |
| 粮食 | 0.461 | -0.190 | -0.344 | 0.089 | -0.004 |
| 特征值 | 4.327 | 1.140 | 0.336 | 0.194 | 0.003 |
| 累计贡献率/% | 0.721 | 0.911 | 0.967 | 0.999 | 1 |
表4
回归分析结果"
| 土地利用类型 | 回归方程 | 显著性水平 |
|---|---|---|
| 农田 | Y=0.429X1+0.282X2 | R2=88.74%, F=11.82 |
| 林地 | Y=-0.330X1-0.384X2 | R2=63.93%, F=2.66 |
| 高覆盖植被 | Y=0.190X2-0.287X2 | R2=25.07%, F=0.50 |
| 中覆盖植被 | Y=-0.105X1+0.618X2 | R2=48.30%, F=1.40 |
| 低覆盖植被 | Y=0.094X1-0.737X2 | R2=65.76%, F=2.88 |
| 建设用地 | Y=0.278X1-0.744X2 | R2=96.50%, F=41.40 |
| 未利用土地 | Y=-0.426X1-0.161X2 | R2=81.44%, F=6.58 |
| [1] |
Parker D C, Manson S M, Janssen M A, et al. Multi-agent systems for the simulation of land-use and land-cover change: A review[J]. Annals of the Association of American Geographers, 2003, 93(2):314-337.
doi: 10.1111/1467-8306.9302004 |
| [2] | 王一航, 夏沛, 刘志锋, 等. 中国绿洲城市土地利用/覆盖变化研究进展[J]. 干旱区地理, 2019, 42(2):341-353. |
| [ Wang Yihang, Xia Pei, Liu Zhifeng, et al. Research progress of urban land use/cover change in the oasis cities of China[J]. Arid Land Geography, 2019, 42(2):341-353. ] | |
| [3] |
胡栩, 聂勇, 徐霞, 等. 塔里木盆地南缘和田地区土地利用变化的遥感研究[J]. 地理科学进展, 2020, 39(4):577-590.
doi: 10.18306/dlkxjz.2020.04.005 |
|
[ Hu Xu, Nie Yong, Xu Xia, et al. Monitoring land-use change in Hetian Tarim Basin, China using satellite remote sensing observation between 1990 and 2016[J]. Progress in Geography, 2020, 39(4):577-590. ]
doi: 10.18306/dlkxjz.2020.04.005 |
|
| [4] | 刘纪远, 张增祥, 庄大方, 等. 20世纪90年代中国土地利用变化时空特征及其成因分析[J]. 地理研究, 2003, 22(1):1-12. |
| [ Liu Jiyuan, Zhang Zengxiang, Zhuang Dafang, et al. A study on the spatial-temporal dynamic changes of land-use and driving forces analyses of China in the 1990s[J]. Geographical Research, 2003, 22(1):1-12. ] | |
| [5] | 丁建丽, 塔西甫拉提·特依拜, 熊黑钢, 等. 塔里木盆地南缘绿洲土地覆盖变化[J]. 地理学报, 2002, 57(1):19-27. |
| [ Ding Jianli, Tashpolat Tiyip, Xiong Heigang, et al. Oasis land cover change in the southern edge of Tarim Basin[J]. Acta Geographica Sinica, 2002, 57(1):19-27. ] | |
| [6] | 杨爱民, 朱磊, 陈署晃, 等. 1975—2015年玛纳斯河流域土地利用变化的地学信息图谱分析[J]. 应用生态学报, 2019, 30(11):3863-3874. |
| [ Yang Aimin, Zhu Lei, Chen Shuhuang, et al. Analysis of geoscientional information map of land use change in the Manas River Basin from 1975 to 2015[J]. Chinese Journal of Applied Ecology, 2019, 30(11):3863-3874. ] | |
| [7] |
Lai S, Leone F, Zoppi C, et al. Land cover changes and environmental protection: A study based on transition matrices concerning Sardinia (Italy)[J]. Land Use Policy, 2017, 67:126-150.
doi: 10.1016/j.landusepol.2017.05.030 |
| [8] |
Zhang Fei, Ayinuer Y, Wang Dongfeng, et al. Ecological risk assessment due to land use/cover changes (LUCC) in Jinghe County, Xinjiang, China from 1990 to 2014 based on landscape patterns and spatial statistics[J]. Environmental Earth Sciences, 2018, 77(13):1-16.
doi: 10.1007/s12665-017-7169-5 |
| [9] |
Xie Yuchu, Gong Jie, Sun Peng, et al. Oasis dynamics change and its influence on landscape pattern on Jinta oasis in arid China from 1963a to 2010a: Integration of multi-source satellite images[J]. International Journal of Applied Earth Observation and Geoinformation, 2014, 33:181-191.
doi: 10.1016/j.jag.2014.05.008 |
| [10] |
Li Xia, Chen Guangzhao, Liu Xiaoping, et al. A new global land-use and land-cover change product at a 1 km resolution for 2010 to 2100 based on human-environment interactions[J]. Annals of the American Association of Geographers, 2017, 107(5):1040-1059.
doi: 10.1080/24694452.2017.1303357 |
| [11] |
刘纪远, 宁佳, 匡文慧, 等. 2010—2015年中国土地利用变化的时空格局与新特征[J]. 地理学报, 2018, 73(5):789-802.
doi: 10.11821/dlxb201805001 |
|
[ Liu Jiyuan, Ning Jia, Kuang Wenhui, et al. Spatio-temporal patterns and characteristics of land-use change in China during 2010-2015[J]. Acta Geographica Sinica, 2018, 73(5):789-802. ]
doi: 10.11821/dlxb201805001 |
|
| [12] | 刘方田, 许尔琪. 基于土地利用的新疆兵团与非兵团生境质量时空演变的对比[J]. 应用生态学报, 2020, 31(7):2341-2351. |
| [ Liu Fangtian, Xu Erqi. Comparison of spatial-temporal evolution of habitat quality between Xinjiang Corps and Non-Corps region based on land use[J]. Chinese Journal of Applied Ecology, 2020, 31(7):2341-2351. ] | |
| [13] | 王福红, 赵锐锋, 张丽华, 等. 黑河中游土地利用转型过程及其对区域生态质量的影响[J]. 应用生态学报, 2017, 28(12):4057-4066. |
| [ Wang Fuhong, Zhao Ruifeng, Zhang Lihua, et al. Process of land use transition and its impact on regional ecological quality in the middle reaches of Heihe River,China[J]. Chinese Journal of Applied Ecology, 2017, 28(12):4057-4066. ] | |
| [14] | 刘新春, 张远东, 任光耀, 等. 新疆阜康荒漠绿洲景观格局动态及其影响因子分析[J]. 应用生态学报, 2004, 15(7):1197-1202. |
| [ Liu Xinchun, Zhang Yuandong, Ren Guangyao, et al. Dynamics of ecological landscape pattern and its affecting factors in desert-oasis in Fukang, Xinjiang[J]. Chinese Journal of Applied Ecology, 2004, 15(7):1197-1202. ] | |
| [15] | 孙晨, 贡璐, 马勇刚, 等. 塔里木河上游典型绿洲土地利用时空格局分析[J]. 西北农林科技大学学报(自然科学版), 2020, 48(7):113-122. |
| [ Sun Chen, Gong Lu, Ma Yonggang, et al. Temporal and spatial pattern analysis of land use in typical oasis in the upper reaches of the Tarim River[J]. Journal of Northwest A & F University(Natural Science Edition), 2020, 48(7):1-10. ] | |
| [16] |
Turner B. Local faces, global flows: The role of land use and land cover in global environmental change[J]. Land Degradation & Development, 1994, 5(2):71-78.
doi: 10.1002/(ISSN)1099-145X |
| [17] | 丁玥, 阿布都热合曼·哈力克, 陈香月, 等. 和田地区植被覆盖变化及气候因子驱动分析[J]. 生态学报, 2020, 40(4):1258-1268. |
| [ Ding Yue, Abdirahman Halik, Chen Xiangyue, et al. Spatial-temporal changes in vegetation characteristics and climate in Hotan prefecture[J]. Acta Ecologica Sinica, 2020, 40(4):1258-1268. ] | |
| [18] | 康紫薇, 张正勇, 位宏, 等. 基于土地利用变化的玛纳斯河流域景观生态风险评价[J]. 生态学报, 2020, 40(18):1-14. |
| [ Kang Ziwei, Zhang Zhengyong, Wei Hong, et al. Landscape ecological risk assessment in Manas River Basin based on land use change[J]. Acta Ecologica Sinica, 2020, 40(18):1-14. ] | |
| [19] |
Guan Qingyu, Yang Liqin, Pan Ninghui, et al. Greening and browning of the Hexi corridor in Northwest China: Spatial patterns and responses to climatic variability and anthropogenic drivers[J]. Remote Sensing, 2018, 10(8):1-20.
doi: 10.3390/rs10010001 |
| [20] | 罗格平, 周成虎, 陈曦. 干旱区绿洲土地利用与覆被变化过程[J]. 地理学报, 2003, 58(1):63-72. |
| [ Luo Geping, Zhou Chenghu, Chen Xi. Process of land use/land cover change in the oasis of arid region[J]. Acta Geographica Sinica, 2003, 58(1):63-72. ] | |
| [21] | 杨依天, 郑度, 张雪芹, 等. 1980-2010年和田绿洲土地利用变化空间耦合及其环境效应[J]. 地理学报, 2013, 68(6):813-824. |
| [ Yang Yitian, Zhen Du, Zhang Xueqin, et al. The spatial coupling of land use changes and its environmental effects on Hotan oasis during 1980-2010[J]. Acta Geographica Sinica, 2013, 68(6):813-824. ] | |
| [22] | 陈忠升, 陈亚宁, 李卫红. 新疆和田河流域土地利用/覆被变化及其驱动力分析[J]. 中国沙漠, 2010, 30(2):326-333. |
| [ Chen Zhongsheng, Chen Yaning, Li Weihong. Land use/cover change and their driving forces in Hotian River Basin of Xinjiang[J]. Journal of Desert Research, 2010, 30(2):326-333. ] | |
| [23] | 张军峰, 孟凡浩, 包安明, 等. 新疆孔雀河流域人工绿洲近40年土地利用/覆被变化[J]. 中国沙漠, 2018, 38(3):664-672. |
| [ Zhang Junfeng, Meng Fanhao, Bao Anming, et al. Land use/cover change in artificial oases of Kongquehe River basin in Xinjiang in the past 40 years[J]. Journal of Desert Research, 2018, 38(3):664-672. ] | |
| [24] |
Yu Y, Markus D, Yu R D, et al. Large-scale hydrological modeling and decision-making for agricultural water consumption and allocation in the main stem Tarim River, China[J]. Water, 2015, 7(6):2821-2839.
doi: 10.3390/w7062821 |
| [25] | 刘纪远, 匡文慧, 张增祥, 等. 20世纪80年代末以来中国土地利用变化的基本特征与空间格局[J]. 地理学报, 2014, 69(1):3-14. |
| [ Liu Jiyuan, Kuang Wenhui, Zhang Zengxiang, et al. Spatiotemporal characteristics, patterns and causes of land use changes in China since the late 1980s[J]. Acta Geographica Sinica, 2014, 69(1):3-14. ] | |
| [26] | 孙帆, 王弋, 陈亚宁. 塔里木盆地荒漠-绿洲过渡带动态变化及其影响因素[J]. 生态学杂志, 2020, 39(10):3397-3407. |
| [ Sun Fan, Wang Yi, Chen Yaning. Dynamics of desert-oasis ecotone and its influencing factors in Tarim Basin[J]. Acta Ecologica Sinica, 2020, 39(10):3397-3407. ] | |
| [27] | 刘毅. 塔里木盆地南缘绿洲灌区地表水与地下水联合利用研究[D]. 乌鲁木齐:新疆大学, 2019. |
| [ Liu Yi. Combined Utilization Research of Surface Water and Groundwater in Oasis Irrigation District of Southern Margin of Tarim Basin[D]. Urumqi: Xinjiang University, 2019. ] | |
| [28] | 曾佳, 郭峰, 赵灿, 等. 塔克拉玛干沙漠南缘小绿洲近50 a来气候变化特征[J]. 干旱区地理, 2014, 37(5):948-957. |
| [ Zeng Jia, Guo Feng, Zhao Can, et al. Climate change of small oases in the southern margin of Taklimakan Desert in recent 50 years[J]. Arid Land Geography, 2014, 37(5):948-957. ] | |
| [29] |
Das S, Sarkar R. Predicting the land use and land cover change using Markov model: A catchment level analysis of the Bhagirathi-Hugli Rive[J]. Spatial Information Research, 2019, 27(4):439-452.
doi: 10.1007/s41324-019-00251-7 |
| [30] |
罗娅, 杨胜天, 刘晓燕, 等. 黄河河口镇—潼关区间1998-2010年土地利用变化特征[J]. 地理学报, 2014, 69(1):42-53.
doi: 10.11821/dlxb201401004 |
|
[ Luo Ya, Yang Shengtian, Liu Xiaoyan, et al. Land use change in the reach from Hekouzhen to Tongguan of the Yellow River during 1998-2010[J]. Acta Geographica Sinica, 2014, 69(1):42-53. ]
doi: 10.11821/dlxb201401004 |
|
| [31] | 付建新, 曹广超, 郭文炯. 1980—2018年祁连山南坡土地利用变化及其驱动力[J]. 应用生态学报, 2020, 31(8):2699-2709. |
| [ Fu Jianxin, Cao Guangchao, Guo Wenjiong. Land use change and its driving force on the south slope of Qilian Mountains from 1980 to 2018[J]. Chinese Journal of Applied Ecology, 2020, 31(8):2699-2709. ] | |
| [32] | 颉耀文, 弥沛峰, 田菲. 近50年甘肃省张掖市甘州区绿洲时空变化过程[J]. 生态学杂志, 2014, 33(1):198-205. |
| [ Xie Yaowen, Mi Peifeng, Tian Fei. The temporal and spatial change of the oasis in Ganzhou District, Zhangye City of Gansu Province in the recent five decades[J]. Acta Ecologica Sinica, 2014, 33(1):198-205. ] | |
| [33] |
Ma M, Veroustraete F. Reconstructing pathfinder AVHRR land NDVI time-series data for the Northwest of China[J]. Advances in Space Research, 2006, 37(4):835-840.
doi: 10.1016/j.asr.2005.08.037 |
| [34] | 孙天瑶, 李雪梅, 许民, 等. 2000—2018年塔里木河流域植被覆盖时空格局[J]. 干旱区地理, 2020, 43(2):415-424. |
| [ Sun Tianyao, Li Xuemei, Xu Min, et al. Spatial-temporal variations of vegetation coverage in the Tarim River Basin from 2000 to 2018[J]. Arid Land Geography, 2020, 43(2):415-424. ] | |
| [35] |
王兮之, 葛剑平. 40多年来塔南策勒绿洲动态变化研究[J]. 植物生态学报, 2004, 28(3):369-375.
doi: 10.17521/cjpe.2004.0053 |
|
[ Wang Xizhi, Ge Jianping Dynamic changes of the Cele oasis over a 40 year period[J]. Acta Phytoecologica Sinica, 2004, 28(3):369-375. ]
doi: 10.17521/cjpe.2004.0053 |
|
| [36] | 叶贵祥, 李维青, 田源. 基于NDVI的干旱区典型绿洲植被覆盖动态变化分析——以策勒绿洲为例[J]. 干旱区资源与环境, 2009, 23(9):128-133. |
| [ Ya Guixiang, Li Weiqing, Tian Yuan. Dynamic changes of vegetation cover in typical oasis of arid areas based on NDVI: A case study in Cele oasis[J]. Journal of Arid Land Resources and Environment, 2009, 23(9):128-133. ] | |
| [37] | 白燕英, 高聚林, 张宝林. 基于Landsat8影像时间序列NDVI的作物种植结构提取[J]. 干旱区地理, 2019, 42(4):893-901. |
| [ Bai Yanying, Gao Julin, Zhang Baolin. Extraction of crop planting structure based on time-series NDVI of Landsat8 images[J]. Arid Land Geography, 2019, 42(4):893-901. ] | |
| [38] | 汉瑞英, 赵志平, 肖能文, 等. 2000-2015年新疆南部地区土地利用/覆被变化及其驱动力分析[J]. 科技通报, 2020, 36(2):24-31. |
| [ Han Ruiying, Zhao Zhiping, Xiao Nengwen, et al. Analysis on the land use change and its driving forces in southern region of Xinjiang province during 2010-2015[J]. Bulletin of Science and Technology, 2020, 36(2):24-31. ] | |
| [39] | 张树森, 杨军, 陈曦. 新疆绿洲地区县域城乡总体规划特色研究——以新疆和田地区策勒县为例[J]. 规划师, 2010, 26(增刊2):41-44. |
| [ Zhang Shusen, Yang Jun, Chen Xi. Desert oasis county level urban-rural planning: Xinjiang Autonomous Region, Cele county example[J]. Planners, 2010, 26(Suppl. 2):41-44. ] | |
| [40] | 郝兴明, 李卫红, 陈亚宁, 等. 塔里木河干流土地利用/覆盖变化的社会经济驱动力分析[J]. 中国沙漠, 2007, 27(3):405-411. |
| [ Hao Xingming, Li Weihong, Chen Yaning, et al. Analysis of socio-economic driving forces on land use and land cover change in Tarim River Basin[J]. Journal of Desert Research, 2007, 27(3):405-411. ] |
| [1] | 张彬, 郑新军, 王玉刚, 唐立松, 李彦, 杜澜, 田胜川. 1990—2022年天山北坡地区不同开垦年限耕层土壤盐分变化[J]. 干旱区研究, 2024, 41(9): 1435-1445. |
| [2] | 王婷, 沈赣华, 刘兵, 孙莹琳, 汪再光. 天山北坡经济带水库群时空变化特征及驱动机制[J]. 干旱区研究, 2024, 41(9): 1456-1467. |
| [3] | 孙琳琳, 刘琼, 黄观, 陈勇航, 魏鑫, 郭玉琳, 张太西, 高天一, 许赟红. 新疆和周边“一带一路”地区不同云天条件下地表太阳辐射[J]. 干旱区研究, 2024, 41(9): 1480-1490. |
| [4] | 郝潘潘, 刘志有. 新疆绿洲土地利用隐性形态与土地生态安全协调特征——以伊犁河谷为例[J]. 干旱区研究, 2024, 41(9): 1605-1614. |
| [5] | 袁征, 张志高, 闫瑾, 刘嘉毅, 胡柱钰, 王赟, 蔡茂堂. 1960—2020年黄河流域不同等级降水时空特征[J]. 干旱区研究, 2024, 41(8): 1259-1271. |
| [6] | 张群慧, 常亮, 顾小凡, 王倩, 马卯楠, 李小等, 段瑞, 犹香智. 1979—2020年柴达木盆地人体舒适度指数时空变化及趋势分析[J]. 干旱区研究, 2024, 41(8): 1300-1308. |
| [7] | 吴思源, 郝利娜. 2001—2021年黄河流域植被覆盖变化及其驱动因素[J]. 干旱区研究, 2024, 41(8): 1373-1384. |
| [8] | 史天艺, 张萌萌, 蒲阳, 刘硕元. 毛乌素沙地植被NDVI动态及对降水的多时空响应[J]. 干旱区研究, 2024, 41(8): 1395-1404. |
| [9] | 高鹏程, 岳艳妮, 鄢继选, 王世杰, 别强. 甘南藏族自治州土地利用与生态风险时空演变及驱动因素[J]. 干旱区研究, 2024, 41(7): 1140-1152. |
| [10] | 吴朝巧, 林菲, 牛俊杰, 耿甜伟. 山西中部城市群生态系统服务对土地利用格局变化的响应[J]. 干旱区研究, 2024, 41(7): 1153-1166. |
| [11] | 李冰洁, 范志韬, 曲芷程, 姚顺予, 宿夏姝, 刘东伟, 王立新. 基于InVEST-PLUS模型的黄河流域内蒙古段生态系统碳储量评价及预测[J]. 干旱区研究, 2024, 41(7): 1217-1227. |
| [12] | 张顺鑫, 吴子豪, 闫庆武, 李桂娥, 牟守国. 基于PLUS-InVEST模型的天山北坡生态系统碳储量时空变化与预测[J]. 干旱区研究, 2024, 41(7): 1228-1237. |
| [13] | 杨锁华, 李丽, 马江德, 郭文霞. “三生空间”视角下陕西省1990—2020年土地利用转型及梯度效应[J]. 干旱区研究, 2024, 41(7): 1249-1258. |
| [14] | 周建伟, 罗君, 马雪洋. 拉萨河流域土地利用与生态系统服务价值时空演变及驱动因素[J]. 干旱区研究, 2024, 41(6): 1021-1031. |
| [15] | 董彭蓓, 任宗萍, 李鹏, 王凯博, 贺国凯, 王璞. 土地利用变化下宁夏生态系统服务权衡协同关系研究[J]. 干旱区研究, 2024, 41(6): 1032-1044. |
|
||