干旱区研究 ›› 2025, Vol. 42 ›› Issue (6): 1114-1125.doi: 10.13866/j.azr.2025.06.14 cstr: 32277.14.AZR.20250614
魏倩1,2( ), 马全林2(), 赵锐锋3
收稿日期:2024-06-23
修回日期:2025-04-16
出版日期:2025-06-15
发布日期:2025-06-11
通讯作者:
马全林. E-mail: mql925@126.com作者简介:魏倩(1999-),女,硕士研究生,主要从事荒漠生态研究. E-mail: wqsy256@163.com
基金资助:
WEI Qian1,2(), MA Quanlin2(), ZHAO Ruifeng3
Received:2024-06-23
Revised:2025-04-16
Published:2025-06-15
Online:2025-06-11
摘要:
八步沙区域地处青藏高原生态屏障与北方防沙带的交汇地带,是抵御腾格里沙漠南侵的前沿阵地,评估其生态环境质量的变化对评价区域防沙治沙成效、推进“三北”工程攻坚战具有一定指导意义。本研究基于Google Earth Engine(GEE)平台数据,探讨1986—2021年八步沙区域土地利用格局变化趋势,利用归一化植被指数(NDVI)、沙漠化指数(DI)和遥感生态指数(RSEI)对区域生态环境质量的时空变化进行综合评估。 结果表明:(1) 在时间尺度上,八步沙区域荒漠面积持续减少、草地面积持续增加、植被覆盖度增加。1986—2021年NDVI和RSEI呈波动上升趋势,其中NDVI由0.14上升至0.31,增长幅度达1倍以上;RSEI由0.22上升至0.24,增幅为9.39%;DI呈波动下降趋势,由0.79递减至0.57,累计降幅达27.85%。(2) 在空间尺度上,NDVI和RSEI高值区集中在研究区南部及西北部且以林地和耕地为主,低值区分布在研究区北部且以极低覆盖度植被和荒漠为主。(3) 研究区NDVI和RSEI趋势变化以不显著/显著增加为主,DI以不显著减少为主。其中,NDVI不显著、显著增加区域占比达12.12%、61.10%;RSEI不显著、显著增加区域占比达5.06%、38.63%,生态环境质量改善区域集中在人类活动较多的西北部和东南部。1986—2021年八步沙区域植被覆盖度明显提高,生态环境质量持续改善,防沙治沙成效显著,形成了可复制的八步沙模式。
魏倩, 马全林, 赵锐锋. 古浪县八步沙区域生态环境质量变化[J]. 干旱区研究, 2025, 42(6): 1114-1125.
WEI Qian, MA Quanlin, ZHAO Ruifeng. Change in the ecological environment quality in Babusha region in the Gulang County[J]. Arid Zone Research, 2025, 42(6): 1114-1125.

图1
研究区概况图"


图2
1986—2021年八步沙区域土地利用类型空间分布"

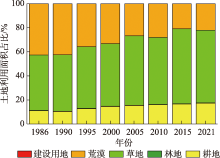
图3
1986—2021年八步沙区域不同土地利用类型面积占比"
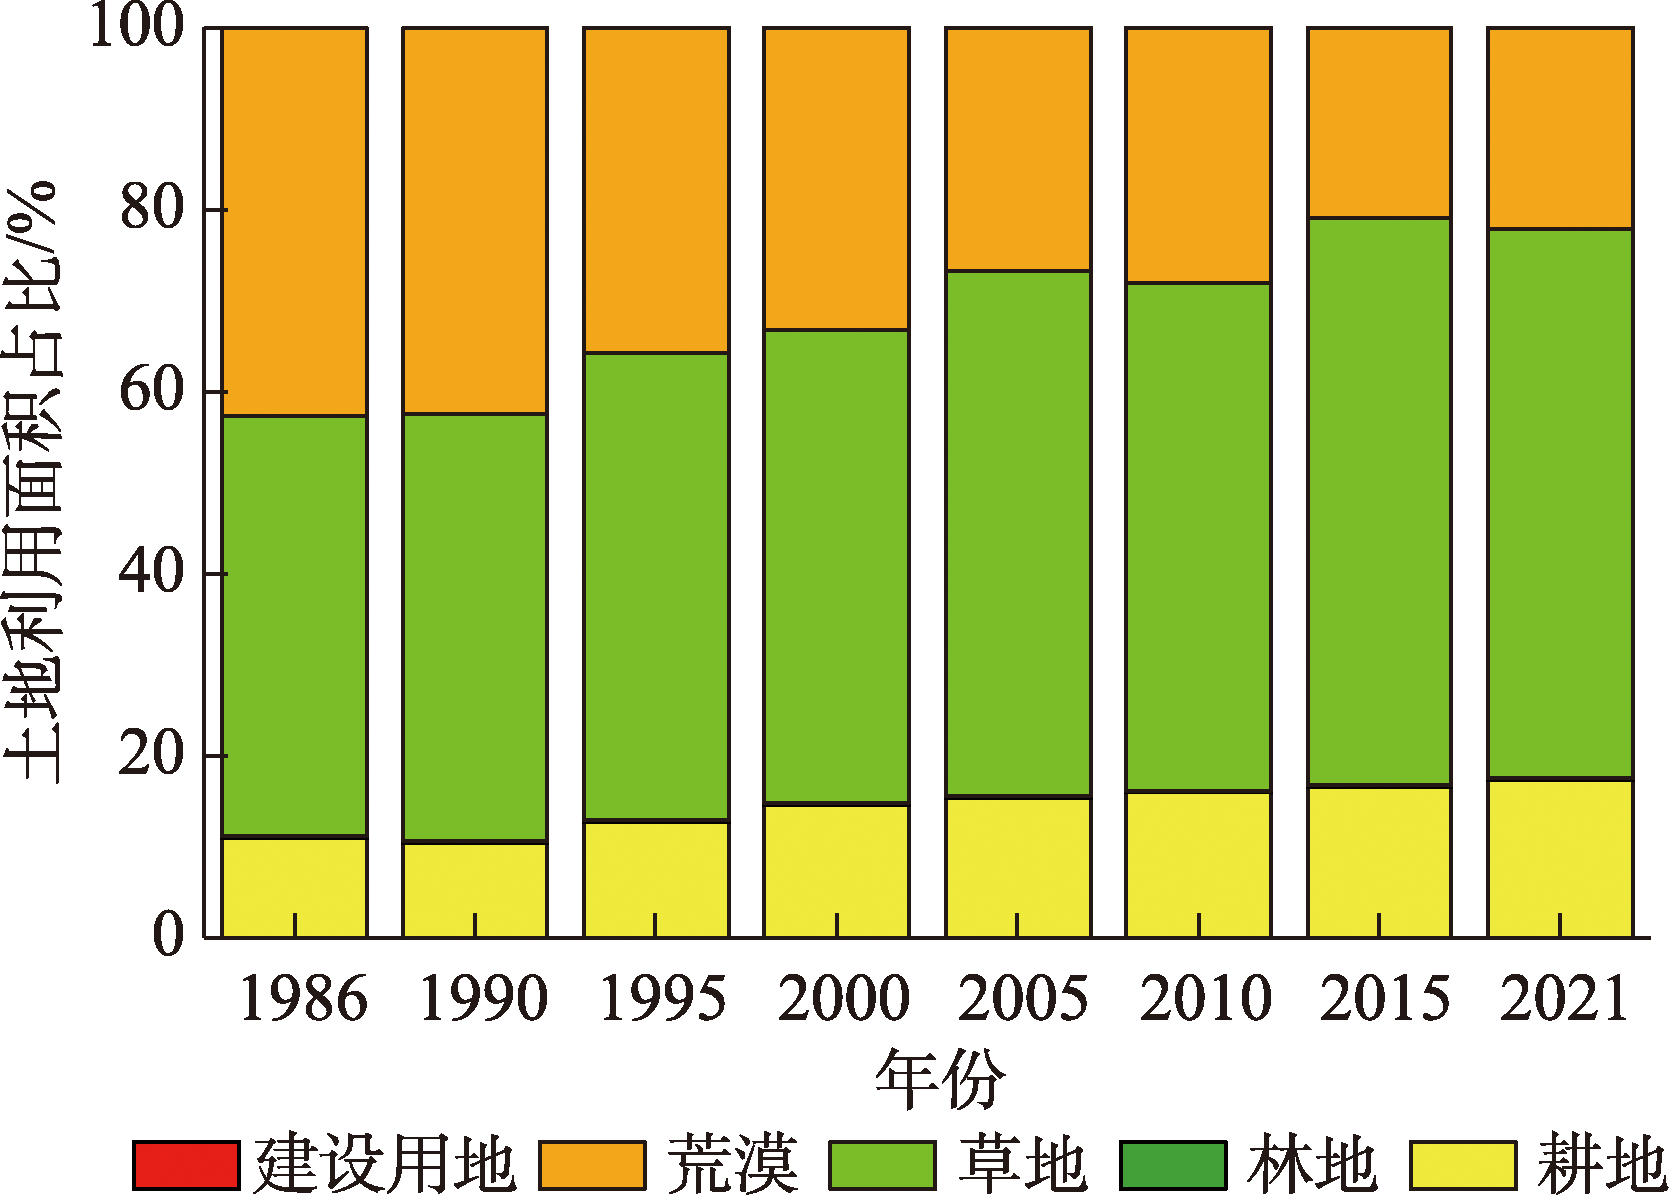

图4
1986—2021年八步沙区域NDVI、DI、RSEI时间变化"


图5
1986—2021年八步沙区域NDVI分级"

表1
八步沙区域NDVI各等级面积占比"
| NDVI | 1986年 | 1990年 | 1995年 | 2000年 | 2005年 | 2010年 | 2015年 | 2021年 |
|---|---|---|---|---|---|---|---|---|
| 极低值 | 0.02 | 0.02 | 0.21 | 0.47 | 0.10 | 0.44 | 0.19 | 0.04 |
| 低值 | 92.16 | 92.05 | 85.83 | 86.38 | 83.78 | 81.09 | 79.44 | 70.78 |
| 中值 | 4.27 | 5.17 | 7.40 | 7.14 | 7.10 | 5.94 | 7.21 | 13.43 |
| 高值 | 2.20 | 1.86 | 4.51 | 4.31 | 4.63 | 6.05 | 6.29 | 5.06 |
| 极高值 | 1.35 | 0.90 | 2.05 | 1.70 | 4.40 | 6.49 | 6.87 | 10.69 |
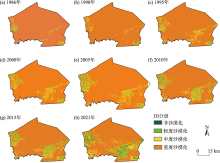
图6
1986—2021年八步沙区域DI分级"

表2
八步沙区域DI各等级面积占比"
| DI | 1986年 | 1990年 | 1995年 | 2000年 | 2005年 | 2010年 | 2015年 | 2021年 |
|---|---|---|---|---|---|---|---|---|
| 非沙漠化 | 0.01 | 0.04 | 0.02 | 0.02 | 0.01 | 0.02 | 0.03 | 1.19 |
| 轻度沙漠化 | 0.92 | 0.63 | 1.64 | 2.11 | 3.18 | 5.07 | 6.16 | 9.18 |
| 中度沙漠化 | 3.05 | 2.55 | 6.63 | 6.65 | 6.84 | 8.91 | 9.51 | 13.16 |
| 重度沙漠化 | 96.02 | 96.77 | 91.72 | 91.21 | 89.98 | 86.01 | 84.31 | 76.47 |
图7
1986—2021年八步沙区域RSEI分级"

表3
八步沙区域RSEI各等级面积占比"
| RSEI等级 | 1986年 | 1990年 | 1995年 | 2000年 | 2005年 | 2010年 | 2015年 | 2021年 |
|---|---|---|---|---|---|---|---|---|
| 差 | 54.23 | 68.36 | 61.16 | 54.84 | 64.91 | 53.55 | 52.25 | 62.35 |
| 较差 | 36.40 | 25.24 | 24.48 | 29.54 | 20.61 | 26.01 | 30.40 | 21.41 |
| 中等 | 6.93 | 5.35 | 10.20 | 11.51 | 8.26 | 9.28 | 14.48 | 5.05 |
| 良好 | 2.07 | 0.76 | 3.63 | 3.74 | 4.85 | 8.47 | 2.56 | 5.46 |
| 优秀 | 0.38 | 0.28 | 0.53 | 0.36 | 1.38 | 2.70 | 0.31 | 5.73 |
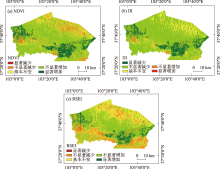
图8
1986—2021年八步沙区域NDVI、DI、RSEI变化趋势"

| [1] |
程莉, 宁志英, 杨红玲, 等. 固沙措施对流动沙丘植被和土壤特性的影响[J]. 中国沙漠, 2024, 44(2): 273-282.
doi: 10.7522/j.issn.1000-694X.2024.00021 |
|
[Cheng Li, Ning Zhiying, Yang Hongling, et al. Effects of different sand-fixation measures on vegetation and soil characteristics of high and flat mobile dunes[J]. Journal of Desert Research, 2024, 44(2): 273-282.]
doi: 10.7522/j.issn.1000-694X.2024.00021 |
|
| [2] | 王涛. 中国沙漠与沙漠化[M]. 河北: 河北科学技术出版社, 2003. |
| [Wang Tao. Deserts and Aeolian Desertification in China[M]. Hebei: Hebei Science & Technology Press, 2003.] | |
| [3] | 任利广, 马维伟, 李广, 等. 基于GIS的甘肃省农牧交错带土地沙化敏感性时空分布格局[J]. 干旱区资源与环境, 2022, 36(6): 149-156. |
| [Ren Liguang, Ma Weiwei, Li Guang, et al. Temporal and spatial distribution pattern of landdeserti-fication sensitivity in agro pastoral ecotone of Gansu Province[J]. Journal of Arid Land Resources and Environment, 2022, 36(6): 149-156.] | |
| [4] | 刘冰晶, 杨艳昭, 李依. 北方农牧交错带土地利用结构特征定量研究——以西辽河流域为例[J]. 干旱区资源与环境, 2018, 32(6): 64-71. |
| [Liu Bingjing, Yang Yanzhao, Li Yi. Quantitative analysis of land use structure characteristicsover the farming-pastoral zone in the west Liaohe River Basin, northern China[J]. Journal of Arid Land Resources and Environment, 2018, 32(6): 64-71.] | |
| [5] | 朱尖. 试论北疆文化的学理与实践定位[J]. 内蒙古社会科学, 2024, 45(1): 33-39. |
| [Zhu Jian. The theoretical and practical orientation of culture of the northern frontier of China[J]. Inner Mongolia Social Sciences, 2024, 45(1): 33-39.] | |
| [6] | 杨景云, 金鑫, 金彦香, 等. 高寒内陆河流域湿地面积变化及其影响因素研究[J/OL]. 生态学报, 2025, 45(8): 1-16. [2025-04-08]. |
| [Yang Jingyun, Jin Xin, Jin Yanxiang, et al. Wetland area change and influencing factors in alpineinland river basin[J/OL]. Acta Ecologica Sinica, 2025, 45(8): 1-16. [2025-04-08].] | |
| [7] | 王天宏, 蒋馥根, 龙依, 等. 1990—2020年长江源地区生态环境质量动态变化及驱动力分析[J/OL]. 南京林业大学学报(自然科学版), 1-9, [2025-04-08]. |
| [Wang Tianhong, Jiang Fugen, Long Yi, et al. Dynamic changes and driving forces of ecological environment quality in the source region of the Yangtze River from 1990 to 2020[J/OL]. Journal of Nanjing Forestry University (Natural Science Edition), 1-9, [2025-04-08].] | |
| [8] | 黄豪奔, 徐海量, 林涛, 等. 2001—2020年新疆阿勒泰地区归一化植被指数时空变化特征及其对气候变化的响应[J]. 生态学报, 2022, 42(7): 2798-2809. |
| [Huang Haoben, Xu Hailiang, Lin Tao, et al. Spatio-temporal variation characteristicsof NDVI and its response to climate change in the Altay region of Xinjiang from 2001 to 2020[J]. Acta Ecologica Sinica, 2022, 42(7): 2798-2809.] | |
| [9] | Zhou Y, Hu Z, Geng Q, et al. Monitoring and analysis of desertification surrounding Qinghai Lake (China) using remote sensing big data[J]. Environmental Science and Pollution Research, 2023, 30(7): 17420-17436. |
| [10] | 徐涵秋. 区域生态环境变化的遥感评价指数[J]. 中国环境科学, 2013, 33(5): 889-897. |
| [Xu Hanqiu. A remote sensing index for assessment of regional ecological changes[J]. China Environmental Science, 2013, 33(5): 889-897.] | |
| [11] | 石敏, 李慧颖, 贾明明. 基于GEE云平台与Landsat数据的山口自然保护区红树林时空变化分析[J]. 自然资源遥感, 2023, 35(2): 61-69. |
| [Shi Min, Li Huiying, Jia Mingming. Spatio-temporal variations in mangrove forests in the Shankou Mangrove Nature Reserve based on the GEE cloud platform and Landsat data[J]. Remote Sensing for Natural Resources, 2023, 35(2): 61-69.] | |
| [12] |
赵安周, 田新乐. 基于GEE平台的1986—2021年黄土高原植被覆盖度时空演变及影响因素[J]. 生态环境学报, 2022, 31(11): 2124-2133.
doi: 10.16258/j.cnki.1674-5906.2022.11.003 |
|
[Zhao Anzhou, Tian Xinle. Spatiotemporal evolution and influencing factors of vegetation coverage in the Loess Plateau from 1986 to 2021 Based on GEE Platform[J]. Ecology and Environment Sciences, 2022, 31(11): 2124-2133.]
doi: 10.16258/j.cnki.1674-5906.2022.11.003 |
|
| [13] | 张神宝, 王永芳, 郭恩亮, 等. 基于GEE的奈曼旗植被覆盖时空演变及驱动力分析[J]. 草业科学, 2023, 40(8): 1965-1976. |
| [Zhang Shenbao, Wang Yongfang, Guo Enliang, et al. Spatial and temporal evolution and its driving forceon vegetation cover in Naiman Banner based on Google Earth Engine[J]. Pratacultural Science, 2023, 40(8): 1965-1976.] | |
| [14] | 王乐. 合作治理视角下西部地区荒漠化治理研究[D]. 兰州: 兰州大学, 2022. |
| [Wang Le. Research on Desertification Control Model in the Western Region under the View of Cooperative Governance—Acase of “Six Old Men” in Babusha[D]. Lanzhou: Lanzhou University, 2022.] | |
| [15] | 许冬梅, 梁开军, 张兴林. 甘肃省古浪县八步沙林场践行“两山”理论的调查与思考[J]. 环境保护, 2019, 47(21): 73-74. |
| [Xu Dongmei, Liang Kaijun, Zhang Xinglin. Investigation and reflection on practicing the theory of “two mountains” in Babusha Forest Farm, Gulang County, Gansu Province[J]. Environmental Protection, 2019, 47(21): 73-74.] | |
| [16] | 胡晓娟, 李霞, 王讷. 八步沙林场防沙治沙区植被覆盖度时空演变分析[J]. 地理空间信息, 2022, 20(1): 66-69, 8. |
| [Hu Xiaojuan, Li Xia, Wang Nan. Spatio-temporal evolution analysis of vegetation coverage in Babusha forest farm sand control area[J]. Geospatial Information, 2022, 20(1): 66-69, 8.] | |
| [17] |
马婧, 郭方君, 邹枝慧, 等. 腾格里沙漠南缘不同恢复阶段沙质草地植被的季节变化特征[J]. 草业学报, 2023, 32(5): 203-210.
doi: 10.11686/cyxb2022210 |
|
[Ma Jing, Guo Fangjun, Zou Zhihui, et al. Seasonal variation in vegetation during restoration of sandy grassland at the southern edge of the Tengger Desert[J]. Acta Prataculturae Sinica, 2023, 32(5): 203-210.]
doi: 10.11686/cyxb2022210 |
|
| [18] | 赵鹏, 徐先英, 屈建军, 等. 民勤绿洲荒漠过渡带人工梭梭群落与水土因子的关系[J]. 生态学报, 2017, 37(5): 1496-1505. |
| [Zhao Peng, Xu Xianying, Qu Jianjun, et al. Relationships between artificial Haloxylon ammodendron comm unitiesand soil water factors in Minqin oasis-desert ecotone[J]. Acta Ecologica Sinica, 2017, 37(5): 1496-1505.] | |
| [19] |
Yang J, Huang X. The 30 m annual land cover dataset and its dynamics in China from 1990 to 2019[J]. Earth System Science Data, 2021, 13(8): 3907-3925.
doi: 10.5194/essd-13-3907-2021 |
| [20] |
梁植, 孙若辰, 段青云. 黄河水源涵养区植被NDVI时空变化特征及其驱动因子[J]. 地理科学进展, 2023, 42(9): 1717-1732.
doi: 10.18306/dlkxjz.2023.09.005 |
| [Liang Zhi, Sun Ruochen, Duan Qingyun. Spatiotemporal variation of NDVI in the Yellow River waterconservation zone and its driving factors[J]. Progress in Geoscience, 2023, 42(9): 1717-1732.] | |
| [21] |
付沙沙, 彭威, 邵爱梅, 等. 秦巴山区夏季NDVI变化特征及其对气候因子的响应[J]. 干旱区研究, 2023, 40(10): 1563-1574.
doi: 10.13866/j.azr.2023.10.03 |
|
[Fu Shasha, Peng Wei, Shao Aimei, et al. Variations in the NDVI characteristics during the summer and the climatic factor responses in the Qinling-Daba Mountains[J]. Arid Zone Research, 2023, 40(10): 1563-1574.]
doi: 10.13866/j.azr.2023.10.03 |
|
| [22] |
申子傲, 吴静, 李纯斌. 2000—2020年河西内陆河流域植被覆盖时空变化特征及其驱动力[J]. 中国沙漠, 2024, 44(3): 119-127.
doi: 10.7522/j.issn.1000-694X.2023.00180 |
|
[Shen Ziao, Wu Jing, Li Chunbin. Temporal and spatial changes of vegetation cover and its driving forces in the Hexi inland river basin from 2000 to 2020[J]. Journal of Desert Research, 2024, 44(3): 119-127.]
doi: 10.7522/j.issn.1000-694X.2023.00180 |
|
| [23] | Duo L, Wang J, Zhang F, et al. Assessing the spatiotemporal evolution and drivers of ecological environment quality using an enhanced remote sensing ecological index in lanzhou City, China[J]. Remote Sensing, 2023, 15(19): 4707. |
| [24] |
赵鸿雁, 颜长珍, 李森, 等. 黄河流域2000—2020年土地沙漠化遥感监测及驱动力分析[J]. 中国沙漠, 2023, 43(3): 127-137.
doi: 10.7522/j.issn.1000-694X.2022.00152 |
|
[Zhao Hongyan, Yan Changzhen, Li Sen, et al. Remote sensing monitoring of aeolian desertification and quantitative analysis of its driving force in the Yellow River Basin during 2000-2020[J]. Journal of Desert Research, 2023, 43(3): 127-137.]
doi: 10.7522/j.issn.1000-694X.2022.00152 |
|
| [25] | Zhang Q, Xiang Y, Sun C, et al. Exploration of ecological environment quality in the “Two Mountains, Seven Rivers and One Basin” area of Shanxi Province, China[J]. Journal of Mountain Science, 2025, 22(3): 966-982. |
| [26] | 陈帅, 昝梅. 新疆伊犁地区植被水分利用效率时空格局研究[J]. 生态科学, 2023, 42(2): 127-138. |
| [Chen Shuai, Zan Mei. Temporal and spatial patterns of WUE in Yili, Xinjiang[J]. Ecological Science, 2023, 42(2): 127-138.] | |
| [27] | 龚天星. 高质量打造古浪八步沙林场“两山”实践创新基地的对策研究[J]. 农业科技与信息, 2023(5): 93-96. |
| [Gong Tianxing. Research on countermeasures to build the “two mountains” practice and innovation base of Gulang Baibusha Forest Farm with high quality[J]. Agricultural Science-Technology and Information, 2023(5): 93-96.] | |
| [28] | 李佳霖. 古浪县沙漠化时空演变格局及对气候-人作用的响应机制分析[D]. 淄博: 山东理工大学, 2024. |
| [Li Jialin. Analysis of Spatial-temporal Evolution Pattern of Desertification and Its Response Mechanism to Climate-Human Interactionin Gulang County[D]. Zibo: Shandong University of Technology, 2024.] | |
| [29] |
张清雨, 赵东升, 吴绍洪, 等. 基于生态分区的内蒙古地区植被覆盖变化及其影响因素研究[J]. 地理科学, 2013, 33(5): 594-601.
doi: 10.13249/j.cnki.sgs.2013.05.594 |
| [Zhang Qingyu, Zhao Dongsheng, Wu Shaohong, et al. Research on vegetation changes and influence factors based on eco-geographical regions of Inner Mongolia[J]. Geographical Science, 2013, 33(5): 594-601.] | |
| [30] | 胡丽莉. 古浪县近51年气候变化特征[J]. 现代农业科技, 2011(17): 17-18. |
| [Hu Lili. Change characteristics of meteorological elements in the last 51 years of Gulang County[J]. Modern Agricultural Science and Technology, 2011(17): 17-18.] | |
| [31] | 罗晓玲, 赵慧华, 杨梅, 等. 基于MCI的河西走廊东部近60年干旱特征及对厄尔尼诺事件的响应[J/OL]. 沙漠与绿洲气象, 1-11, [2025-04-08]. |
| [Luo Xiaoling, Zhao Huihua, Yang Mei, et al. Characteristics of drought and response to El Niño events over the last 60 years in eastern Hexi Corridor based on MCI[J/OL]. Desert and Oasis Meteorology, 1-11, [2025-04-08].] | |
| [32] |
王婷婷, 冯起, 郭小燕, 等. 1959—2014年古浪河流域降水变化特征及突变分析[J]. 高原气象, 2019, 38(6): 1251-1262.
doi: 10.7522/j.issn.1000-0534.2019.00068 |
|
[Wang Tingting, Feng Qi, Guo Xiaoyan, et al. Variation characteristics and mutation analysis of precipitationin the Gulang River Basin during the Period 1959-2014[J]. Plateau Meteorology, 2019, 38(6): 1251-1262.]
doi: 10.7522/j.issn.1000-0534.2019.00068 |
|
| [33] | 胡晓娟. 利用长时序卫星影像评估防沙治沙区植被变化[J]. 北京测绘, 2024, 38(5): 739-744. |
| [Hu Xiaojuan. Assessmentofvegetation change in desertification prevention and control areas using long time series satellite images[J]. Beijing Surveying and Mapping, 2024, 38(5): 739-744.] | |
| [34] | 安婧荣. 古浪县北部沙区林分退化原因及修复措施[J]. 现代园艺, 2025, 48(6): 168-170. |
| [An Jingrong. Causes of forest degradation and restoration measures in the sandy area of northern Gulang County[J]. Contemporary Horticulture, 2025, 48(6): 168-170.] |
| [1] | 安彬, 陈文靖, 肖薇薇. 气候变暖背景下黄土高原≥0 ℃和≥10 ℃积温时空变化[J]. 干旱区研究, 2025, 42(6): 981-992. |
| [2] | 沙贝宁, 杨余辉, 黄佛君, 叶茂. 中国西北地区逆温时空变化[J]. 干旱区研究, 2025, 42(3): 397-408. |
| [3] | 张起鹏, 路红娥, 赵頔琛, 卓玛兰草. 甘南黄河上游植被覆盖度时空变化与地形因子的关系[J]. 干旱区研究, 2025, 42(3): 523-522. |
| [4] | 李琪, 党国锋, 鱼腾飞, 张浪, 陈薇宇. 基于GEE的干旱区县域生态环境质量时空变化及驱动力分析——以阿拉善左旗为例[J]. 干旱区研究, 2025, 42(2): 360-371. |
| [5] | 张彬, 郑新军, 王玉刚, 唐立松, 李彦, 杜澜, 田胜川. 1990—2022年天山北坡地区不同开垦年限耕层土壤盐分变化[J]. 干旱区研究, 2024, 41(9): 1435-1445. |
| [6] | 孙琳琳, 刘琼, 黄观, 陈勇航, 魏鑫, 郭玉琳, 张太西, 高天一, 许赟红. 新疆和周边“一带一路”地区不同云天条件下地表太阳辐射[J]. 干旱区研究, 2024, 41(9): 1480-1490. |
| [7] | 戚曌, 闫峰, 席磊, 曹晓明, 邹佳秀, 冯益明. 鄂尔多斯高原砒砂岩区植被恢复潜力[J]. 干旱区研究, 2024, 41(9): 1583-1592. |
| [8] | 袁征, 张志高, 闫瑾, 刘嘉毅, 胡柱钰, 王赟, 蔡茂堂. 1960—2020年黄河流域不同等级降水时空特征[J]. 干旱区研究, 2024, 41(8): 1259-1271. |
| [9] | 张群慧, 常亮, 顾小凡, 王倩, 马卯楠, 李小等, 段瑞, 犹香智. 1979—2020年柴达木盆地人体舒适度指数时空变化及趋势分析[J]. 干旱区研究, 2024, 41(8): 1300-1308. |
| [10] | 张宏伟, 别强, 石莹, 苏晓杰, 李欣璋. 黄河流域上游植被覆盖变化特征及其影响因素[J]. 干旱区研究, 2024, 41(8): 1385-1394. |
| [11] | 郑柳娜, 江红南, 孙梦婷. 基于遥感影像的新疆渭干河—库车河三角洲土壤水盐与植被覆盖度的关系[J]. 干旱区研究, 2024, 41(7): 1131-1139. |
| [12] | 裴志林, 曹晓娟, 王冬, 李迪, 王鑫, 白艾原. 内蒙古植被覆盖时空变化特征及其对人类活动的响应[J]. 干旱区研究, 2024, 41(4): 629-638. |
| [13] | 赵东颖, 蒙仲举, 孟芮冰, 马泽. 乌兰布和沙漠风沙入黄段植被覆盖动态变化特征及驱动力[J]. 干旱区研究, 2024, 41(4): 639-649. |
| [14] | 周义, 索文姣. 基于CWSI的汾河流域干旱时空变化特征[J]. 干旱区研究, 2024, 41(2): 191-199. |
| [15] | 王思楠, 吴英杰, 王宏宙, 黎明扬, 王飞, 张雯颖, 马小茗, 于向前. 基于地理探测器的鄂尔多斯干旱时空变化驱动因素分析[J]. 干旱区研究, 2024, 41(12): 1981-1991. |
|
||