干旱区研究 ›› 2022, Vol. 39 ›› Issue (5): 1564-1575.doi: 10.13866/j.azr.2022.05.21 cstr: 32277.14.AZR.20220521
姚佳1( ),陈启慧1,李琼芳1,2(),崔罡1,张良憬3
收稿日期:2022-04-18
修回日期:2022-06-25
出版日期:2022-09-15
发布日期:2022-10-25
作者简介:姚佳(1998-),女,硕士研究生,研究方向为生态水文. E-mail: 基金资助:
YAO Jia1(),CHEN Qihui1,LI Qiongfang1,2(),CUI Gang1,ZHANG Liangjing3
Received:2022-04-18
Revised:2022-06-25
Published:2022-09-15
Online:2022-10-25
摘要:
基于多种遥感数据,运用Mann-Kendall法、Theil-Sen median 趋势分析、Pearson相关分析、水量平衡原理,探讨2000—2020年伊犁河—巴尔喀什湖流域实际蒸散发时空变化规律及其主要影响因素,并讨论了流域生态系统水资源供给量的变化。结果表明:(1) 流域上、中、下游的多年平均年蒸散发量分别为439.0 mm、317.9 mm、201.1 mm;其中上、中游在夏季的日蒸散发量最大,而下游在春季最大;流域上、中游蒸散发量的年内分配均为“单峰型”,峰值分别在7月与6月,下游为“双峰型”,峰值分别在3月与11月。(2) 流域上、下游的年蒸散发量均呈现显著的上升趋势,显著区域主要分布在上游的伊犁河谷、天山山脉与下游的伊犁河三角洲附近;相对2000—2010年,2010—2020年伊犁河谷和伊犁河三角洲地区多年平均年蒸散发增加超过10%。(3) 流域上、中游蒸散发与气温和NDVI呈现较高的正相关性;流域下游蒸散发与土壤湿度呈现较高的正相关性。(4) 流域生态系统的水资源供给服务总量在2000—2020年有所下降,其中上游已多次出现缺口,中、下游在2020年开始出现缺口,需通过控制用水总量、提升用水效率保障水资源供需平衡。
姚佳,陈启慧,李琼芳,崔罡,张良憬. 伊犁河—巴尔喀什湖流域实际蒸散发时空变化特征及其环境影响因子[J]. 干旱区研究, 2022, 39(5): 1564-1575.
YAO Jia,CHEN Qihui,LI Qiongfang,CUI Gang,ZHANG Liangjing. Spatial and temporal variability of evapotranspiration and influencing factors in the Ili River-Balkhash Lake Basin[J]. Arid Zone Research, 2022, 39(5): 1564-1575.
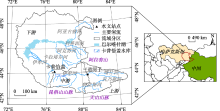
图1
伊巴流域地理位置 注:底图采用自然资源部标准地图制作,审图号为 GS(2021)5452号,对底图边界无修改。下同。"

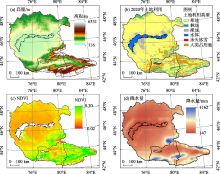
图2
伊巴流域基础信息空间分布"
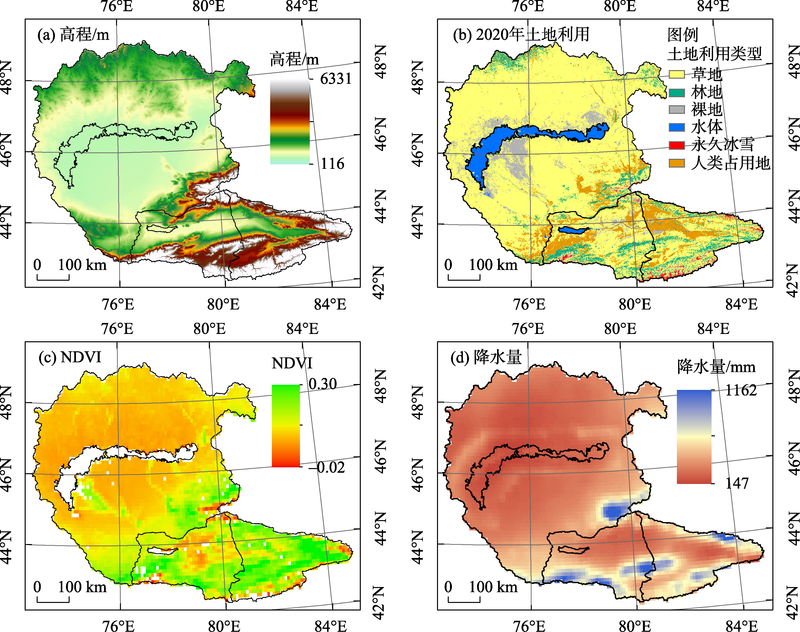
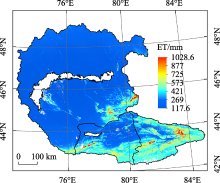
图3
2000—2020多年平均年ET的空间分布特征"


图4
2000—2020年蒸散发的M-K趋势检验Z值的空间分布"


图5
流域上、中、下游年蒸散发总量年际变化"
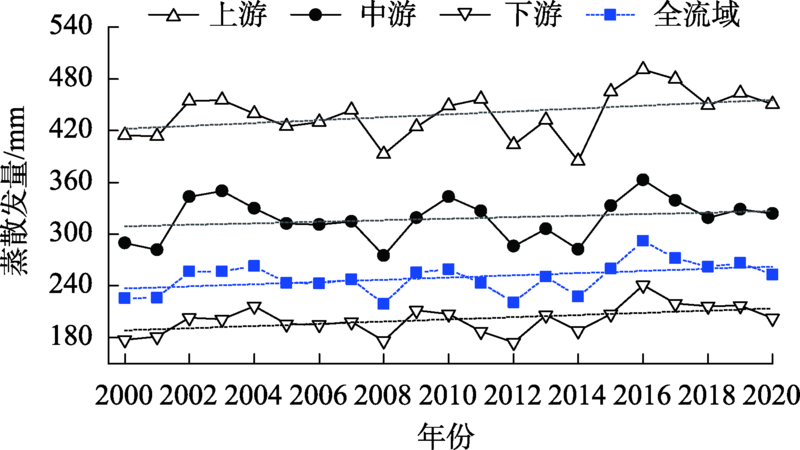
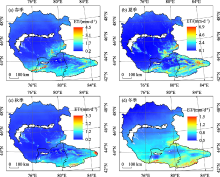
图6
2000—2020年四季蒸散发空间分布特征"

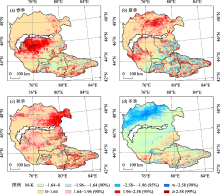
图7
2000—2020年蒸散发的四季M-K趋势检验Z值空间分布"

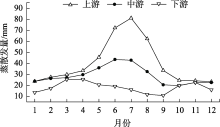
图8
2000—2020年多年平均蒸散发的年内分配"
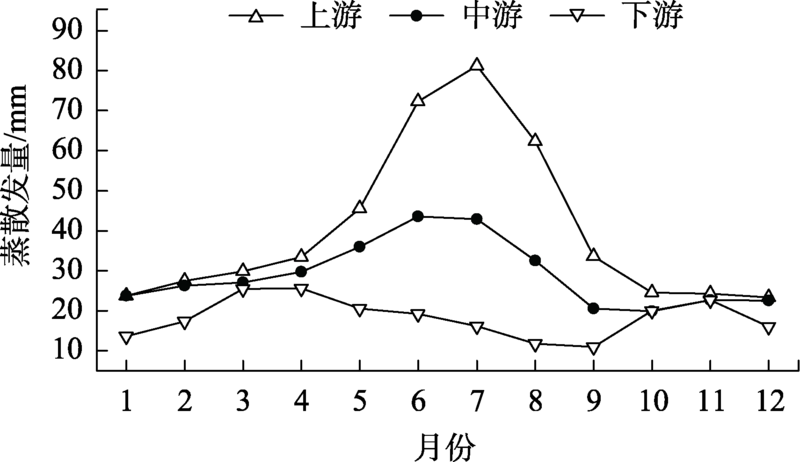
表1
2000—2020 年月蒸散发的年际变化率"
| 1月 | 2月 | 3月 | 4月 | 5月 | 6月 | 7月 | 8月 | 9月 | 10月 | 11月 | 12月 | |
|---|---|---|---|---|---|---|---|---|---|---|---|---|
| 上游 | 0.011 | -0.041 | -0.038 | 0.264 | 0.191 | 0.239 | 0.455 | 0.249 | 0.25* | 0.151 | -0.039 | 0.020 |
| 中游 | 0.047 | -0.036 | 0.040 | 0.247 | 0.272 | -0.023 | 0.008 | 0.094 | 0.224 | 0.052 | -0.033 | 0.019 |
| 下游 | -0.112 | -0.150 | 0.055 | 0.425** | 0.178 | 0.284 | 0.245 | 0.148 | 0.267** | 0.196 | -0.086 | -0.022 |
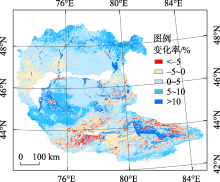
图9
2010—2020年相对2000—2010年多年平均年ET变化率"
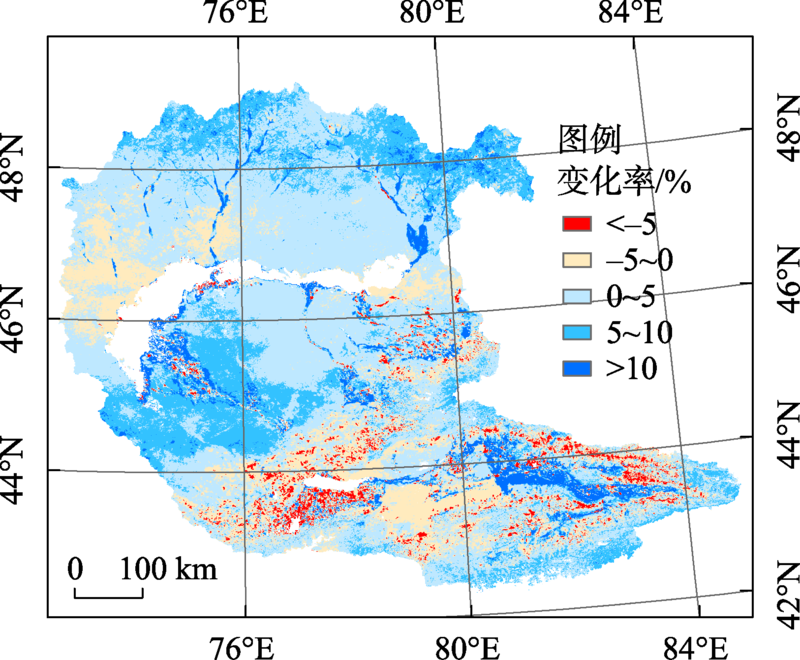
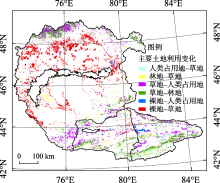
图10
土地利用转移空间分布 注:图中仅显示面积变化>500 km2的土地利用变化类型。"

表2
2000—2020 年间环境因子的年际变化率"
| 区域 | 降水量/(mm·a-1) | 相对湿度/(%·a-1) | 气温/(℃·a-1) | 风速/(m·s-1·a-1) | 土壤湿度/(kg·m-2 a-1) | NDVI/(10a)-1 |
|---|---|---|---|---|---|---|
| 上游 | -1.65 | 0.06 | -0.013 | -0.002 | 0.27 | 0.016? |
| 中游 | -5.77? | 0.09 | -0.016 | -0.003 | 0.10 | 0.010 |
| 下游 | -1.73 | 0.20? | -0.028 | 0.005 | 0.15 | 0.011? |

图11
2000—2020年多年平均环境影响因素的年内分配"

表3
流域上、中、下游蒸散发量与环境因子的相关性"
| 影响因素 | 上游 | 中游 | 下游 |
|---|---|---|---|
| NDVI | 0.735** | 0.681** | 0.012 |
| 风速 | -0.283** | -0.033 | 0.129* |
| 温度 | 0.790** | 0.552** | -0.129* |
| 相对湿度 | -0.288** | -0.095 | 0.160* |
| 土壤湿度 | -0.246** | -0.094 | 0.304** |
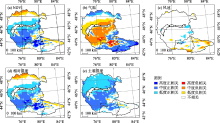
图12
蒸散发与环境因子的相关系数的空间分布 注: 仅显示通过95%显著性检验的数据。"
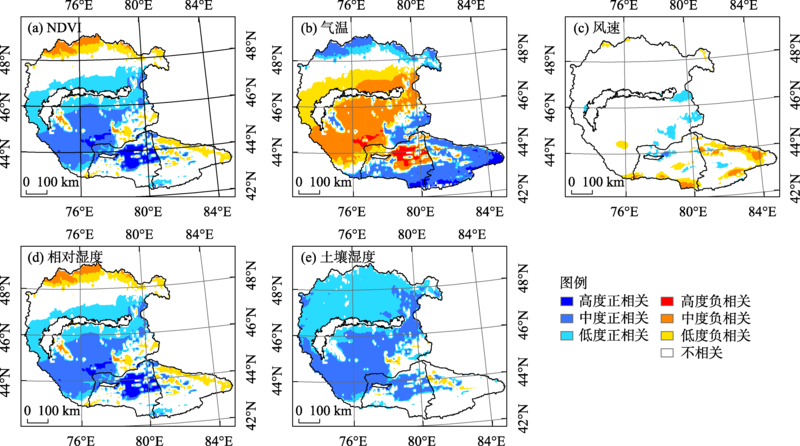

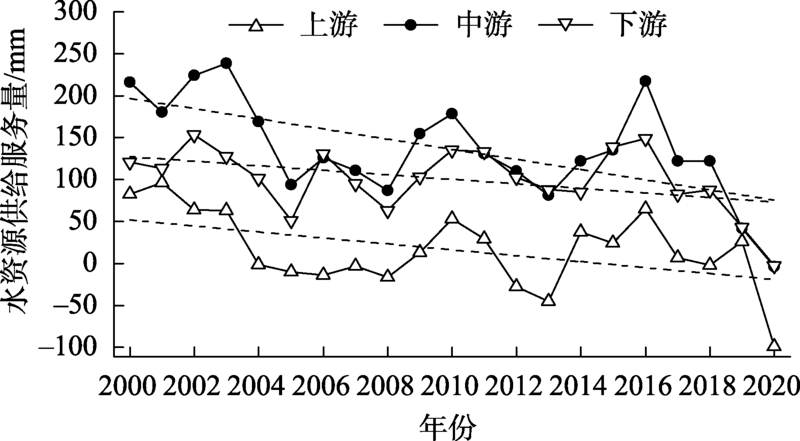
图13
2000—2020年生态系统的水资源供给服务量的年际变化"
| [1] | 邓铭江, 王志杰, 王姣妍. 巴尔喀什湖生态水位演变分析及调控对策[J]. 水利学报, 2011, 42(4): 403-413. |
| [Deng Mingjiang, Wang Zhijie, Wang Jiaoyan. Analysis of Balkhash Lake ecological water level evolvement and its regulation strategy[J]. Journal of Hydraulic Engineering, 2011, 42(4): 404-413. ] | |
| [2] |
段伟利, 邹珊, 陈亚宁, 等. 1879-—2015年巴尔喀什湖水位变化及其主要影响因素分析[J]. 地球科学进展, 2021, 36(9): 950-961.
doi: 10.11867/j.issn.1001-8166.2021.088 |
|
[Duan Weili, Zou Shan, Chen Yaning, et al. Analysis of water level changes in Lake Balkhash and its main influencing factors during 1879-2015[J]. Advances in Earth Science, 2021, 36(9): 950-961. ]
doi: 10.11867/j.issn.1001-8166.2021.088 |
|
| [3] | 孙佳龙, 郭金运, 常晓涛, 等. 利用卫星测高和重力的巴尔喀什湖水位变化监测[J]. 武汉大学学报(信息科学版), 2011, 36(4): 401-406. |
| [Sun Jialong, Guo Jinyun, Chang Xiaotao, et al. Balkhash Lake level variations monitored with satellite altimeter and satellite gravity data[J]. Geomatics and Information Science of Wuhan University, 2011, 36(4): 401-406. ] | |
| [4] | 谢蕾, 龙爱华, 邓铭江, 等. 伊犁河下游三角洲生态耗水研究[J]. 冰川冻土, 2011, 33(6): 1330-1340. |
| [Xie Lei, Long Aihua, Deng Mingjiang, et al. Study on ecological water consumption in delta of the lower reaches of Ili River[J]. Journal of Glaciology and Geocryology, 2011, 33(6): 1330-1340. ] | |
| [5] | 郑青华, 罗格平, 朱磊, 等. 基于CA_Markov模型的伊犁河三角洲景观格局预测[J]. 应用生态学报, 2010, 21(4): 873-882. |
| [Zheng Qinghua, Luo Geping, Zhu Lei, et al. Prediction of landscape patterns in lli River Delta based on CA_Markov model[J]. Chinese Journal of Applied Ecology, 2010, 21(4): 873-882. ] | |
| [6] | 李修仓. 中国典型流域实际蒸散发的时空变异研究[D]. 南京: 南京信息工程大学, 2013. |
| [Li Xiucang. Spatio-temporal Variation of Actual Evapotranspiration in the Pearl, Haihe and Tarim River Basins of China[D]. Nanjing: Nanjing University of Information Science & Technology, 2013. ] | |
| [7] | 刘洋, 于恩涛, 杨建军, 等. 西北干旱区1960—2019年实际蒸散发时空变化特征[J]. 水土保持研究, 2021, 28(6): 75-80, 89. |
| [Liu Yang, Yu Entao, Yang Jianjun, et al. Characteristics of spatial and temporal variation of actual evapotranspiration in the arid region of northwest China from 1960 to 2019[J]. Research of Soil and Water Conservation, 2021, 28(6): 75-80, 89. ] | |
| [8] | Xia Jiangzhou, Liang Shunlin, Chen Jiquan, et al. Satellite-based analysis of evapotranspiration and water balance in the grassland ecosystems of dryland East Asia[J]. PLOS ONE, 2014, 9(5): e97295. |
| [9] |
Zhang Shengwei, Shen Rui, Zhao Hongbin, et al. Correlating between evapotranspiration and precipitation provides insights into Xilingol grassland eco-engineering at larger scale[J]. Ecological Engineering, 2015, 84: 100-103.
doi: 10.1016/j.ecoleng.2015.07.015 |
| [10] | 闫俊杰, 付秀东, 赵玉, 等. 2001—2015年伊犁河谷草地蒸散发时空变化分析[J]. 水土保持研究, 2019, 26(6): 184-190, 197. |
| [Yan Junjie, Fu Xiudong, Zhao Yu, et al. Spatiotemporal variation of evapotranspiration in the grassland of Ili valley from 2001 to 2015[J]. Research of Soil and Water Conservation, 2019, 26(6): 184-190, 197. ] | |
| [11] | 邓兴耀, 姚俊强, 刘志辉, 等. 2000—2014年天山山区蒸散发时空动态特征[J]. 水土保持研究, 2017, 24(4): 266-273. |
| [Deng Xingyao, Yao Junqiang, Liu Zhihui, et al. Spatiotemporal dynamic change characteristics of evapotranspiration in Tianshan Mountains from 2000 to 2014[J]. Research of Soil and Water Conservation, 2017, 24(4): 266-273. ] | |
| [12] | 梁红闪, 王丹, 郑江华. 伊犁河流域地表蒸散量时空特征分析[J]. 灌溉排水学报, 2020, 39(7): 100-110. |
| [Liang Hongshan, Wang Dan, Zheng Jianghua. Temporal and spatial characteristics of surface evapotranspiration in the Ili River Basin[J]. Journal of Irrigation and Drainage, 2020, 39(7): 100-110. ] | |
| [13] | 肖婷婷, 夏自强, 郭利丹, 等. 巴尔喀什湖流域1936-2005年气温特征[J]. 河海大学学报(自然科学版), 2011, 39(4): 391-396. |
| [Xiao Tingting, Xia Ziqiang, Guo Lidan, et al. Temperature characteristics in the Balkhash Lake Basin from 1936 to 2005[J]. Journal of Hohai University (Natural Sciences Edition), 2011, 39(4): 391-396. ] | |
| [14] | 夏自强, 郭利丹, 黄峰, 等. 巴尔喀什湖-阿拉湖流域水文地理特征分析及人类活动影响研究[M]. 北京: 中国水利水电出版社, 2018: 43, 53. |
| [Xia Ziqiang, Guo Lidan, Huang Feng, et al. Analysis of Hydrographic Characteristics of the Lake Balkhash-Ala Lake Basin and Study of the Impact of Human Activities[M]. Beijing: China Water & Power Press, 2018. ] | |
| [15] | 李元春, 葛静, 侯蒙京, 等. 基于CCI-LC数据的甘南和川西北地区土地覆盖类型时空动态分布及草地面积变化驱动力研究[J]. 草业学报, 2020, 29(3): 1-15. |
| [Li Yuanchun, Ge Jing, Hou Mengjing, et al. A studly of the spatiotemporal dynamic of land cover types and the driving forces of grass and area change in Gannan Prefecture and Northwest Sichuan based on CCI-1C data[J]. Acta Prataculturae Sinica, 2020, 29(3): 1-15. ] | |
| [16] | Mann Henry B. Nonparametric tests against trend[J]. Econometrica, 1945: 245-259. |
| [17] | Kendall Maurice George. Rank Correlation Methods[M]. 5th Edition. London: Edward Arnold: 1990. |
| [18] | 徐勇, 黄雯婷, 靖娟利, 等. 京津冀地区植被NDVI动态变化及其与气候因子的关系[J]. 水土保持通报, 2020, 40(5): 319-327. |
| [Xu Yong, Huang Wenting, Jin Juanli, et al. Dynamic variation of vegetation cover and its relation with climate variables in Beijing-Tianjin-Hebei Region[J]. Bulletin of Soil and Water Conservation, 2020, 40(5): 319-327. ] | |
| [19] | 刘瑞, 朱道林. 基于转移矩阵的土地利用变化信息挖掘方法探讨[J]. 资源科学, 2010, 32(8): 1544-1550. |
| [Liu Rui, Zhu Daolin. Methods for detecting land use changes based on the land use transition matrix[J]. Resources Science, 2010, 32(8): 1544-1550. ] | |
| [20] |
Pearson Karl. Notes on the history of correlation[J]. Biometrika, 1920, 13(1): 25-45.
doi: 10.1093/biomet/13.1.25 |
| [21] | 邱国玉, 熊育久. 水与能: 蒸散发, 热环境及其能量收支[M]. 北京: 科学出版社, 2014. |
| [Qiu Guoyu, Xiong Yujiu. Evapotranspiration Thermal Environment and Energy Budget[M]. Beijing: Science Press, 2014. ] | |
| [22] | 詹云军, 章文, 严岩, 等. 长江流域实际蒸散发演变趋势及影响因素[J]. 生态学报, 2021, 41(17): 6924-6935. |
| [Zhan Yunjun, Zhang Wen, et al. Analysis of actual evapotranspiration evolution and influencing factors in the Yangtze River Basin[J]. Acta Ecologica Sinica, 2021, 41(17): 6924-6935. ] | |
| [23] | 王倩, 杨太保, 杨雪梅. 新疆伊犁河流域植被变化动态监测与评价[J]. 干旱区资源与环境, 2015, 29(8): 126-131. |
| [Wang Qian, Yang Taibao, Yang Xuemei. Monitoring and assessment of vegetation variation over the Ili River Basin in Xinjiang[J]. Journal of Arid Land Resources and Environment, 2015, 29(8): 126-131. ] | |
| [24] | 魏良民, 高明, 贾青德, 等. 新疆丸粒种甜菜适宜播种时间试验[J]. 中国糖料, 2014(1): 24-26. |
| [Wei Liangmin, Gao Ming, Jia Qingde, et al. Suitable sowing time experiment of pellet sugarbeet seed in Xinjiang[J]. Sugar Crops of China, 2014(1): 24-26. ] | |
| [25] | 李杜娟. 伊犁地区红花栽培技术[J]. 现代农业科技, 2018(19): 98, 103. |
| [Li Dujuan. Cultivation technology of safflower in Ili region[J]. Modern Agricultural Science and Technology, 2018(19): 98, 103. ] | |
| [26] |
Thevs Niels, Nurtazin Sabir, Beckmann Volker, et al. Water consumption of agriculture and natural ecosystems along the Ili River in China and Kazakhstan[J]. Water, 2017, 9(3): 207.
doi: 10.3390/w9030207 |
| [27] | 蔡明勇, 杨胜天, 周秋文, 等. 伊犁河跨界流域土地利用变化特征分析[J]. 世界地理研究, 2013, 22(3): 151-159. |
| [Cai Mingyong, Yang Shengtian, Zhou Qiuwen, et al. Land use/cover change analysis in transboundary Ili River Basin[J]. World Regional Studies, 2013, 22(3): 151-159. ] | |
| [28] | 刘婉如, 陈春波, 罗格平, 等. 巴尔喀什湖流域土地利用/覆被变化过程与趋势[J]. 干旱区研究, 2021, 38(5): 1452-1463. |
| [Liu Wanru, Chen Chunbo, Luo Geping, et al. Change process and trends pf land use/cover in Balkhash Lake basin[J]. Arid Zone Research, 2021, 38(5): 1452-1463. ] | |
| [29] | 王宏伟, 张小雷, 乔木, 等. 基于GIS的伊犁河流域生态环境质量评价与动态分析[J]. 干旱区地理, 2008, 31(2): 215-221. |
| [Wang Hongwei, Zhang Xiaolei, Qiao Mu, et al. Assessment and dynamic analysis of the eco-environmental quality in the Ili River Basin based on GIS[J]. Arid Land Geography, 2008, 31(2): 215-221. ] | |
| [30] |
贺添, 邵全琴. 基于MOD16产品的我国2001—2010年蒸散发时空格局变化分析[J]. 地球信息科学学报, 2014, 16(6): 979-988.
doi: 10.3724/SP.J.1047.2014.00979 |
|
[He Tian, Shao Quanqin. Spatial-temporal variation of terrestrial evapotranspiration in China from 2001 to 2010 using MOD16 products[J]. Journal of Geo-Information Science, 2014, 16(6): 979-988. ]
doi: 10.3724/SP.J.1047.2014.00979 |
|
| [31] |
Mu Qiaozhen, Zhao Maosheng, Steven W. Running. Improvements to a MODIS global terrestrial evapotranspiration algorithm[J]. Remote Sensing of Environment, 2011, 115(8): 1781-1800.
doi: 10.1016/j.rse.2011.02.019 |
| [32] |
Mu Qiaozhen, Faith Ann Heinsch, Zhao Maosheng, et al. Development of a global evapotranspiration algorithm based on MODIS and global meteorology data[J]. Remote Sensing of Environment, 2007, 111(4): 519-536.
doi: 10.1016/j.rse.2007.04.015 |
| [33] | 赵玲玲. 流域水文循环模拟中蒸散发估算方法研究[M]. 北京: 中国水利水电出版社, 2019. |
| [Zhao Lingling. A study of Evapotranspiration Estimation Methods in Watershed Hydrological Cycle Simulation[M]. Beijing: China Water & Power Press, 2019. ] | |
| [34] |
张潇, 夏自强, 郭利丹, 等. 1960-2010年巴尔喀什湖流域干湿特征分析[J]. 资源科学, 2016, 38(6): 1118-1128.
doi: 10.18402/resci.2016.06.11 |
|
[Zhang Xiao, Xia Ziqiang, Guo Lidan, et al. Analysis of aridity-wetness characteristics in the Balkhash Lake Basin from 1960 to 2010[J]. Resources Science, 2016, 38(6): 1118-1128. ]
doi: 10.18402/resci.2016.06.11 |
|
| [35] | 刘燕平. 哈萨克斯坦土地管理机构及法律法规[J]. 国土资源情报, 2008(3): 22-25. |
| [Liu Yanping. Land Management Institutions and Laws of Kazakhstan[J]. Land and Resources Information, 2008(3): 22-25. ] | |
| [36] |
Beurs K M, Henebry G M. Land surface phenology, climatic variation, and institutional change: Analyzing agricultural land cover change in Kazakhstan[J]. Remote Sensing of Environment, 2004, 89(4): 497-509.
doi: 10.1016/j.rse.2003.11.006 |
| [37] | Henebry G M, De Beurs K M, et al. Land surface dynamics in Kazakhstan: Dynamic baselines and change detection land surface dynamics in Kazakhstan: Dynamic baselines and change detection[C]// IEEE International Geoscience & Remote Sensing Symposium. IEEE, 2002: 1060-1062. |
| [1] | 张彬, 郑新军, 王玉刚, 唐立松, 李彦, 杜澜, 田胜川. 1990—2022年天山北坡地区不同开垦年限耕层土壤盐分变化[J]. 干旱区研究, 2024, 41(9): 1435-1445. |
| [2] | 孙琳琳, 刘琼, 黄观, 陈勇航, 魏鑫, 郭玉琳, 张太西, 高天一, 许赟红. 新疆和周边“一带一路”地区不同云天条件下地表太阳辐射[J]. 干旱区研究, 2024, 41(9): 1480-1490. |
| [3] | 张文睿, 孙栋元, 王亦可, 杨俊, 兰立军, 靳虎甲, 徐裕. 河西走廊水资源-生态环境-社会经济系统耦合关系及时空分异[J]. 干旱区研究, 2024, 41(9): 1527-1537. |
| [4] | 袁征, 张志高, 闫瑾, 刘嘉毅, 胡柱钰, 王赟, 蔡茂堂. 1960—2020年黄河流域不同等级降水时空特征[J]. 干旱区研究, 2024, 41(8): 1259-1271. |
| [5] | 张群慧, 常亮, 顾小凡, 王倩, 马卯楠, 李小等, 段瑞, 犹香智. 1979—2020年柴达木盆地人体舒适度指数时空变化及趋势分析[J]. 干旱区研究, 2024, 41(8): 1300-1308. |
| [6] | 吴思源, 郝利娜. 2001—2021年黄河流域植被覆盖变化及其驱动因素[J]. 干旱区研究, 2024, 41(8): 1373-1384. |
| [7] | 姚小晨, 高凡, 韩方红, 何兵. 2000—2020年阿克苏河流域土地利用强度变化及其对蒸散发的影响[J]. 干旱区研究, 2024, 41(6): 951-963. |
| [8] | 雷菲亚, 李小双, 陶冶, 尹本丰, 荣晓莹, 张静, 陆永兴, 郭星, 周晓兵, 张元明. 西北干旱区藓类结皮覆盖下土壤多功能性特征及影响因子[J]. 干旱区研究, 2024, 41(5): 812-820. |
| [9] | 裴志林, 曹晓娟, 王冬, 李迪, 王鑫, 白艾原. 内蒙古植被覆盖时空变化特征及其对人类活动的响应[J]. 干旱区研究, 2024, 41(4): 629-638. |
| [10] | 赵东颖, 蒙仲举, 孟芮冰, 马泽. 乌兰布和沙漠风沙入黄段植被覆盖动态变化特征及驱动力[J]. 干旱区研究, 2024, 41(4): 639-649. |
| [11] | 周义, 索文姣. 基于CWSI的汾河流域干旱时空变化特征[J]. 干旱区研究, 2024, 41(2): 191-199. |
| [12] | 王思楠, 吴英杰, 王宏宙, 黎明扬, 王飞, 张雯颖, 马小茗, 于向前. 基于地理探测器的鄂尔多斯干旱时空变化驱动因素分析[J]. 干旱区研究, 2024, 41(12): 1981-1991. |
| [13] | 张倩, 曹广超, 张乐乐, 赵美亮. 祁连山南坡植被绿度时空变化及其对气候变化和人类活动的响应[J]. 干旱区研究, 2024, 41(12): 2143-2153. |
| [14] | 杨楠, 宋孝玉, 邓建伟, 李蓝君, 赵新凯, 孟鹏飞, 符冲, 魏婉茵, 张育斌, 丁林, 李浩霖. 基于改进S-W模型的南小河沟流域蒸散发分配及控制机制[J]. 干旱区研究, 2024, 41(11): 1819-1830. |
| [15] | 王成武, 尧良杰, 汪宙峰, 张荞, 谢亮. 2000—2020年三江源地区景观生态风险评价及驱动因素[J]. 干旱区研究, 2024, 41(11): 1908-1920. |
|
||