干旱区研究 ›› 2021, Vol. 38 ›› Issue (2): 303-313.doi: 10.13866/j.azr.2021.02.02
韩永贵1,2( ),韩磊1,2,3(),黄晓宇1,2,高阳1,2
收稿日期:2020-08-24
修回日期:2020-10-13
出版日期:2021-03-15
发布日期:2021-04-25
通讯作者:
韩磊
作者简介:韩永贵(1993-),男,硕士,研究方向为旱区生态水文过程. E-mail:基金资助:
HAN Yonggui1,2(),HAN Lei1,2,3(),HUANG Xiaoyu1,2,GAO Yang1,2
Received:2020-08-24
Revised:2020-10-13
Online:2021-03-15
Published:2021-04-25
Contact:
Lei HAN
摘要:
饱和水汽压差是土壤-植被-大气连续体水分传输过程的关键影响因素,在全球气候变化背景下,预测西北地区饱和水汽压差,对于植被恢复和农林业气象灾害风险评估具有重要的现实意义。基于西北五省(区)1990—2019年月饱和水汽压差值,采用趋势分析和小波分析等方法研究了西北地区饱和水汽压差年际变化特征和周期性变化规律;采用指数模型和ARIMA模型,筛选最佳样本步长和预测步长,对西北地区饱和水汽压差进行模拟和预测。结果表明:(1) 西北五省(区)中,新疆年均饱和水汽压差最高,其次为宁夏、陕西、甘肃和青海;近30 a整体上西北地区饱和水汽压差呈上升趋势,其中宁夏和新疆饱和水汽压差上升幅度最大,分别为0.036 kPa·(10a)-1和0.033 kPa·(10a)-1,其次为甘肃[0.026 kPa·(10a)-1]、青海[0.021 kPa·(10a)-1]和陕西[0.012 kPa·(10a)-1];(2) 西北各省(区),16 a尺度周期对小波方差贡献最大,为饱和水汽压差变化的主周期。此外,陕西、甘肃和新疆还存在24~27 a的周期特征,方差贡献较小;(3) 相对于指数模型,ARIMA模型均方根误差平均减少42.3%,决定系数R2平均提高11.1%,Nash-Sutclife效率系数平均提高17.7%,有效提高了饱和水汽压差预测精度;(4) 未来一段时间内,西北各地区饱和水汽压差均存在不同程度的升高趋势,以宁夏和新疆地区的饱和水汽压差增幅最为明显,分别为9.5%和8.9%。
韩永贵,韩磊,黄晓宇,高阳. 基于指数平滑和ARIMA模型的西北地区饱和水汽压差预测[J]. 干旱区研究, 2021, 38(2): 303-313.
HAN Yonggui,HAN Lei,HUANG Xiaoyu,GAO Yang. Prediction of vapor pressure deficit in Northwest China based on exponential and ARIMA models[J]. Arid Zone Research, 2021, 38(2): 303-313.
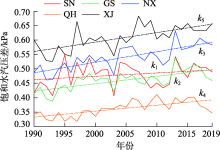
图1
1990—2019年西北五省(区)饱和水汽压差 注:k1~k5分别表示陕西、甘肃、宁夏、青海和新疆的饱和水汽压差倾向斜率;字母SN表示陕西省,GS表示甘肃省,NX表示宁夏回族自治区,QH表示青海省,XJ表示新疆维吾尔族自治区。下同。"

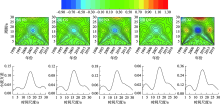
图2
各省(区)饱和水汽压差小波分析"

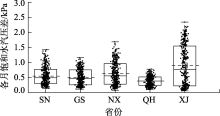
图3
1990—2019年西北五省(区)月饱和水汽压差特征"

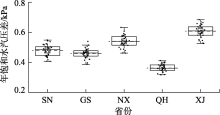
图4
1990—2019年西北五省(区)年饱和水汽压差特征"

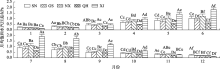
图5
1990—2019年西北五省月均饱和水汽压差比较 注:小写字母表示同一省份各月份水汽压差差异显著性,大写字母表示同一月份各省份水汽压差差异显著性,不同字母表示差异显著(P<0.05)。"

表1
各省(区)饱和水汽压差序列ADF检验结果"
| SN | GS | NX | QH | XJ | ||
|---|---|---|---|---|---|---|
| 原始序列 | T | -4.20 | -2.87 | -3.01 | -2.52 | -2.05 |
| 1% | -3.45 | -3.45 | -3.45 | -3.45 | -3.45 | |
| 5% | -2.86 | -2.86 | -2.86 | -2.86 | -2.86 | |
| 10% | -2.57 | -2.57 | -2.57 | -2.57 | -2.57 | |
| AP/% | 0.10 | 4.90 | 3.50 | 11.20 | 26.56 | |
| 一阶差分 | T | -17.68 | -15.18 | -15.36 | -18.36 | -22.37 |
| 1% | -2.58 | -2.58 | -2.58 | -2.58 | -2.58 | |
| 5% | -1.94 | -1.94 | -1.94 | -1.94 | -1.94 | |
| 10% | -1.62 | -1.62 | -1.62 | -1.62 | -1.62 | |
| AP/% | 0.00 | 0.00 | 0.00 | 0.00 | 0.00 |
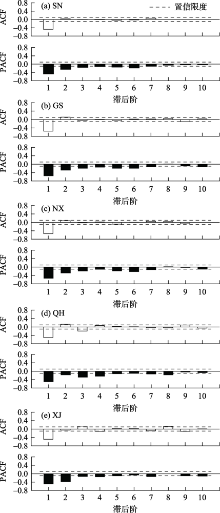
图6
饱和水汽压差一阶差分序列自相关"

表2
ARIMA模型效果对比"
| 省份 | 模型 | 调整的R2 | AIC |
|---|---|---|---|
| SN | ARIMA(1,1,1) | 0.45 | -0.32 |
| ARIMA(2,1,1) | 0.46 | 0.25 | |
| ARIMA(3,1,1) | 0.47 | 0.43 | |
| GS | ARIMA(1,1,1) | 0.39 | -0.78 |
| ARIMA(2,1,1) | 0.45 | -0.02 | |
| ARIMA(3,1,1) | 0.46 | 0.22 | |
| NX | ARIMA(1,1,1) | 0.38 | -0.04 |
| ARIMA(2,1,1) | 0.38 | 0.70 | |
| ARIMA(3,1,1) | 0.37 | 0.92 | |
| QH | ARIMA(1,1,1) | 0.43 | -1.80 |
| ARIMA(2,1,1) | 0.47 | -0.99 | |
| ARIMA(3,1,1) | 0.47 | -0.76 | |
| XJ | ARIMA(2,1,1) | 0.49 | 1.81 |
| ARIMA(3,1,1) | 0.50 | 2.06 |
表3
指数模型效果对比"
| 省份 | 指数模型 | 调整的R2 | 均方根误差 |
|---|---|---|---|
| SN | Holt | 0.67 | 0.130 |
| GS | Holt-Winters | 0.70 | 0.081 |
| NX | Holt-Winters | 0.69 | 0.120 |
| QH | Holt-Winters | 0.71 | 0.046 |
| XJ | Holt-Winters | 0.68 | 0.103 |
表4
模型最佳样本步长"
| 模型 | 最佳样本步长/a | 均方根误差 | 平均绝对误差 |
|---|---|---|---|
| Holt | 4 | 0.086 | 0.067 |
| Holt-Winters | 4 | 0.076 | 0.053 |
| ARIMA(3,1,1) | 16 | 0.113 | 0.079 |
| ARIMA(2,1,1) | 16 | 0.048 | 0.036 |
| ARIMA(1,1,1) | 22 | 0.130 | 0.092 |
表5
不同预测步长下模型输出参数比较"
| 模型 | 模拟步长/a | R2 | 均方根误差 | 相对误差/% | 绝对误差/kPa | NSE |
|---|---|---|---|---|---|---|
| Holt | 3 | 0.76 | 0.1809 | 21.3 | 0.1196 | 0.6713 |
| 5 | 0.75 | 0.1935 | 22.3 | 0.1327 | 0.6383 | |
| 7 | 0.73 | 0.1924 | 22.5 | 0.1320 | 0.6233 | |
| 9 | 0.73 | 0.1910 | 23.2 | 0.1347 | 0.6292 | |
| Holt-Winters | 3 | 0.95 | 0.0939 | 9.8 | 0.0584 | 0.9207 |
| 5 | 0.96 | 0.1003 | 11.7 | 0.0688 | 0.9128 | |
| 7 | 0.95 | 0.1080 | 12.9 | 0.0734 | 0.9013 | |
| 9 | 0.94 | 0.1154 | 14.4 | 0.0802 | 0.8901 | |
| ARIMA(3,1,1) | 3 | 0.97 | 0.0926 | 17.1 | 0.0735 | 0.9543 |
| 5 | 0.96 | 0.0878 | 15.9 | 0.0699 | 0.9566 | |
| 7 | 0.97 | 0.0854 | 17.7 | 0.0697 | 0.9589 | |
| 9 | 0.96 | 0.0878 | 17.4 | 0.0718 | 0.9553 | |
| ARIMA(2,1,1) | 3 | 0.94 | 0.0537 | 9.6 | 0.0363 | 0.9096 |
| 5 | 0.94 | 0.0512 | 9.2 | 0.0363 | 0.9114 | |
| 7 | 0.94 | 0.0461 | 8.7 | 0.0326 | 0.9256 | |
| 9 | 0.92 | 0.0497 | 8.8 | 0.0347 | 0.9154 | |
| ARIMA(1,1,1) | 3 | 0.92 | 0.1111 | 15.0 | 0.0852 | 0.9098 |
| 5 | 0.93 | 0.1063 | 14.9 | 0.0794 | 0.9250 | |
| 7 | 0.93 | 0.1081 | 14.9 | 0.0807 | 0.9243 | |
| 9 | 0.92 | 0.1024 | 14.7 | 0.0806 | 0.9222 |
表6
指数模型和ARIMA模型的预测结果"
| SN | 尺度/a | GS | 尺度/a | NX | 尺度/a | QH | 尺度/a | XJ | 尺度/a | |
|---|---|---|---|---|---|---|---|---|---|---|
| MV/(kPa·mon-1) | 0.55 | - | 0.50 | - | 0.63 | - | 0.38 | - | 0.90 | - |
| PV-E/(kPa·mon-1) | 0.57 | 3 | 0.43 | 3 | 0.61 | 3 | 0.32 | 3 | 0.96 | 3 |
| PV-A /(kPa·mon-1) | 0.57 | 7 | 0.54 | 7 | 0.69 | 5 | 0.41 | 7 | 0.98 | 7 |
表7
水汽压差预测值与实测值水平比较"
| 省份 | SN | GS | NX | QH | XJ |
|---|---|---|---|---|---|
| MV/(kPa·mon-1) | 0.58 | 0.53 | 0.68 | 0.40 | 0.95 |
| PV-E/(kPa·mon-1) | 0.57 | 0.52 | 0.66 | 0.39 | 0.94 |
| PV-A /(kPa·mon-1) | 0.56 | 0.54 | 0.68 | 0.41 | 0.95 |
| [1] |
Grossiord C, Buckley T N, Cernusak L A, et al. Plant responses to rising vapor pressure deficit[J]. The New Phytologist, 2020. DOI: 10.1111/nph.16485.
pmid: 33874632 |
| [2] | Hatfield J L, Prueger J H. Temperature extremes: Effect on plant growth and development[J]. Weather and Climate Extremes, 2015,10(PA):4-10. |
| [3] | Kimm H, Guan K Y, Gentine P, et al. Redefining droughts for the U.S. Corn Belt: The dominant role of atmospheric vapor pressure deficit over soil moisture in regulating stomatal behavior of Maize and Soybean[J]. Agricultural and Forest Meteorology, 2020,287.DOI: 10.1016/j.agrformet.2020.107930. |
| [4] | Williams A P, Allen C D, Macalady A K, et al. Temperature as a potent driver of regional forest drought stress and tree mortality[J]. Nature Climate Change, 2013,3(3):292-297. |
| [5] | Asseng S, Ewert F, Martre P, et al. Rising temperatures reduce global wheat production[J]. Nature Climate Change, 2015,5(2):143-147. |
| [6] | Zhao C, Liu B, Piao S L, et al. Temperature increase reduces global yields of major crops in four independent estimates[J]. Proceedings of the National Academy of Sciences of the United States of America, 2017,114(35):9326-9331. |
| [7] |
Zhang K, Kimball J S, Nemani R R, et al. Vegetation greening and climate change promote multidecadal rises of global land evapotranspiration[J]. Scientific Reports, 2015,5:15956. DOI: 10.1038/srep15956.
pmid: 26514110 |
| [8] |
Yuan W P, Zheng Y, Piao S L, et al. Increased atmospheric vapor pressure deficit reduces global vegetation growth[J]. Science Advances, 2019,5(8): eaax1396.
pmid: 31489370 |
| [9] | Massmann A, Gentine P, Lin C J. When does vapor pressure deficit drive or reduce evapotranspiration?[J]. Journal of Advances in Modeling Earth Systems, 2019,11(10):3305-3320. |
| [10] | Dai A G. Increasing drought under global warming in observations and models[J]. Nature Climate Change, 2013,3(1):52-58. |
| [11] | 李旭谱, 张福平, 胡猛, 等. 基于SPOT NDVI的植被覆盖时空演变规律分析——以西北五省为例[J]. 干旱地区农业研究, 2012,30(5):180-184, 199. |
| [ Li Xupu, Zhang Fuping, Hu Meng, et al. Analysis of the regulation of spatial-temporal variation of the vegetation coverage based on SPOT NDVI data: A case study in Northwest China[J]. Agricultural Research in the Arid Areas, 2012,30(5):180-184, 199. ] | |
| [12] | 赵传成, 王雁, 丁永建, 等. 西北地区近50年气温及降水的时空变化[J]. 高原气象, 2011,30(2):385-390. |
| [ Zhao Chuancheng, Wang Yan, Ding Yongjian, et al. Spatial-temporal variations of temperature and precipitation in Northern China in recent 50 years[J]. Plateau Meteorology, 2011,30(2):385-390. ] | |
| [13] | 刘宪锋, 潘耀忠, 张锦水, 等. 1960—2011年西北五省潜在蒸散的时空变化[J]. 应用生态学报, 2013,24(9):2564-2570. |
| [ Liu Xianfeng, Pan Yaozhong, Zhang Jinshui, et al. Spatiotemporal variation patterns of potential evapotranspiration in five provinces of Northwest China in 1960-2011[J]. Chinese Journal of Applied Ecology, 2013,24(9):2564-2570. ] | |
| [14] | 黄小燕, 李耀辉, 冯建英, 等. 中国西北地区降水量及极端干旱气候变化特征[J]. 生态学报, 2015,35(5):1359-1370. |
| [ Huang Xiaoyan, Li Yaohui, Feng Jianying, et al. Climate characteristics of precipitation and extreme drought events in Northwest China[J]. Acta Ecologica Sinica, 2015,35(5):1359-1370. ] | |
| [15] | 陈小平, 刘廷玺, 王冠丽, 等. 温度和水分对科尔沁草甸湿地净生态系统碳交换量的影响[J]. 应用生态学报, 2018,29(5):1523-1534. |
| [ Chen Xiaoping, Liu Tingxi, Wang Guanli, et al. Effects of temperature and moisture on net ecosystem CO2 exchange over a meadow wetland in the Horqin, China[J]. Chinese Journal of Applied Ecology, 2018,29(5):1523-1534. ] | |
| [16] | 蒋浩, 葛继稳, 刘垚垚, 等. 大九湖亚高山泥炭湿地潜热通量特征及其对环境因子的响应[J]. 安全与环境工程, 2020,27(4):31-40. |
| [ Jiang Hao, Ge Jiwen, Liu Yaoyao, et al. Characteristics of latent heat flux in Dajiuhu sub-alpine peat wetland and its response to environmental factors[J]. Safety and Environmental Engineering, 2020,27(4):31-40. ] | |
| [17] | Cardoso A A, Brodribb T J, Kane C N, et al. Osmotic adjustment and hormonal regulation of stomatal responses to vapour pressure deficit in sunflower[J]. Aob Plants, 2020,12(4). DOI: 10.1093/aobpla/plaa025/5860156. |
| [18] | 曾红霞, 刘强, 赵强. 西北地区昼夜增温的不对称性对植被动态的影响[J]. 生态环境学报, 2020,29(2):260-265. |
| [ Zeng Hongxia, Liu Qiang, Zhao Qiang. Asymmetry of day and nighttime warming and their effects on vegetation dynamics in the Inland areas of Northwest China[J]. Ecology and Environmental Sciences, 2020,29(2):260-265. ] | |
| [19] | 张静, 王力. 黄土塬区苹果园蒸散与环境因素的关系[J]. 林业科学, 2018,54(3):29-38. |
| [ Zhang Jing, Wang Li. The relationship between the evapotranspiration and the environmental factors in the apple orchards in the Loess Tableland Area[J]. Scientia Silvae Sinicae, 2018,54(3):29-38. ] | |
| [20] | 姚增旺, 褚建民, 吴利禄, 等. 民勤绿洲荒漠过渡带梭梭树干液流的时滞特征[J]. 应用生态学报, 2018,29(7):2339-2346. |
| [ Yao Zengwang, Chu Jianmin, Wu Lilu, et al. Time lag characteristics of the stem sap flow of Haloxylon ammodendron in the Minqin oasis-desert ectone, China[J]. Chinese Journal of Applied Ecology, 2018,29(7):2339-2346. ] | |
| [21] | 韩磊, 何俊, 齐拓野, 等. 宁夏河东沙区侧柏冠层气孔导度对环境因子的响应及其模拟[J]. 生态学杂志, 2018,37(9):2862-2868. |
| [ Han Lei, He Jun, Qi Tuoye, et al. Responses and modeling of canopy stomatal conductance of Platycladus orientalis to environmental factors in Hedong sandy land, Ningxia[J]. Chinese Journal of Ecology, 2018,37(9):2862-2868. ] | |
| [22] | 肖晶晶, 李正泉, 郭芬芬, 等. 浙江省1901—2017年降水序列构建及变化特征分析[J]. 气候变化研究进展, 2018,14(6):553-561. |
| [ Xiao Jingjing, Li Zhengquan, Guo Fenfen, et al. Construction and analysis of annual precipitation series from 1901 to 2017 in Zhejiang province[J]. Climate Change Research, 2018,14(6):553-561. ] | |
| [23] | 沈皓俊, 罗勇, 赵宗慈, 等. 基于LSTM网络的中国夏季降水预测研究[J]. 气候变化研究进展, 2020,16(3):263-275. |
| [ Shen Haojun, Luo Yong, Zhao Zongci, et al. Prediction of summer precipitation in China based on LSTM network[J]. Climate Change Research, 2020,16(3):263-275. ] | |
| [24] | 张遇春, 张勃. 黑河中游近49年降水序列变化规律及干旱预测——以张掖市为例[J]. 干旱区资源与环境, 2008,22(1):84-88. |
| [ Zhang Yuchun, Zhang Bo. Study on the prccipitation change and drought prediction of middle reach of Heihe river in current 49 years: Take Zhangye City as an example[J]. Journal of Arid Land Resources and Environment, 2008,22(1):84-88. ] | |
| [25] | 史亚军, 彭勇, 徐炜. 基于灰色离散微分动态规划的梯级水库优化调度[J]. 水力发电学报, 2016,35(12):35-44. |
| [ Shi Yajun, Peng Yong, Xu Wei. Optimal operation model of cascade reservoirs based on grey discrete differential dynamic programming[J]. Journal of Hydroelectric Engineering, 2016,35(12):35-44. ] | |
| [26] | 张姝玮, 郭忠印, 陈立辉. 基于自回归求积移动平均的制动器温度预测方法[J]. 吉林大学学报(工学版), 2020,50(6):2080-2086. |
| [ Zhang Shuwei, Guo Zhongyin, Chen Lihui. Brake temperature prediction method based on autoregressive integrated moving average model[J]. Journal of Jilin University(Engineering and Technology Edition), 2020,50(6):2080-2086. ] | |
| [27] | 李俐, 许连香, 王鹏新, 等. 基于叶面积指数的河北中部平原夏玉米单产预测研究[J]. 农业机械学报, 2020,51(6):198-208. |
| [ Li Li, Xu Lianxiang, Wang Pengxin, et al. Summer maize yield forecasting based on leaf area index[J]. Transactions of the Chinese Society for Agricultural Machinery, 2020,51(6):198-208. ] | |
| [28] | Zhang Y H, Yang H R, Cui H J, et al. Comparison of the ability of ARIMA, WNN and SVM models for drought forecasting in the Sanjiang Plain, China[J]. Natural Resources Research, 2020,29(2):1447-1464. |
| [29] | 田东, 韦鑫化, 王悦, 等. 基于MA-ARIMA-GASVR的食用菌温室温度预测[J]. 农业工程学报, 2020,36(3):190-197. |
| [ Tian Dong, Wei Xinhua, Wang Yue, et al. Prediction of temperature in edible fungi greenhouse based on MA-ARIMA-GASVR[J]. Transactions of the Chinese Society of Agricultural Engineering, 2020,36(3):190-197. ] | |
| [30] | 刘立龙, 陈军, 黄良珂, 等. 基于Holt指数平滑模型的Klobuchar模型精化[J]. 武汉大学学报(信息科学版), 2018,43(4):599-604. |
| [ Liu Lilong, Chen Jun, Huang Liangke, et al. A sophisticated Klobuchar model based on the Holt exponential smoothing model[J]. Geomatics and Information Science of Wuhan University, 2018,43(4):599-604. ] | |
| [31] | 杨刚, 张浩. 基于三次指数平滑法的水泡陈化钢渣中f-CaO含量长期变化趋势研究[J]. 材料导报, 2015,29(24):112-116. |
| [ Yang Gang, Zhang Hao, Research on long-term variation tendency of f-CaO content in sodden aging steel slag based on Holt-winters[J]. Materials Reports, 2015,29(24):112-116. ] | |
| [32] | 段利民, 童新, 吕扬, 等. 固沙植被黄柳、小叶锦鸡儿蒸腾耗水尺度提升研究[J]. 自然资源学报, 2018,33(1):52-62. |
| [ Duan Limin, Tong Xin, Lyu Yang, et al. Upscaling of the transpiration and water consumption of sand-fixing vegetation Salix gordejevii and Caragana microphylla[J]. Journal of Natural Resources, 2018,33(1):52-62. ] | |
| [33] | 葛蓉, 何洪林, 任小丽, 等. 基于模型数据融合的中国温带和亚热带典型森林生态系统碳通量模拟[J]. 生态学报, 2017,37(5):1409-1420. |
| [ Ge Rong, He Honglin, Ren Xiaoli, et al. Carbon flux simulation of typical temperate and subtropical forest ecosystems in China based on model-data fusion approach[J]. Acta Ecologica Sinica, 2017,37(5):1409-1420. ] | |
| [34] | 刘玉莉, 江洪, 周国模, 等. 安吉毛竹林水汽通量变化特征及其与环境因子的关系[J]. 生态学报, 2014,34(17):4900-4909. |
| [ Liu Yuli, Jiang Hong, Zhou Guomo, et al. Water vapor flux variation characteristic and the relationship with its environment factors in phyllostachys edulis forest in Anji[J]. Acta Ecologica Sinica, 2014,34(17):4900-4909. ] | |
| [35] | 杨秋萍, 徐长春, 张晋霞, 等. 2001—2017年开都-孔雀河流域植被物候特征及其对气候变化的响应[J]. 干旱区研究, 2020,37(3):729-738. |
| [ Yang Qiuping, Xu Changchun, Zhang Jinxia, et al. Phenological characteristics of vegetation and its response to climatic change in the Kaidu-Kongqi River basin, Xinjiang, during 2001-2017[J]. Arid Zone Research, 2020,37(3):729-738. ] | |
| [36] | 李博, 陈婷, 王楠, 等. 2017年与2014年西安极端高温天气及其环流特征对比分析[J]. 干旱区研究, 2019,36(3):645-656. |
| [ Li Bo, Chen Ting, Wang Nan, et al. Extremely high temperature and circulation features in Xi’an in 2017 and 2014[J]. Arid Zone Research, 2019,36(3):645-656. ] | |
| [37] | 戴新刚, 任宜勇, 陈洪武. 近50年新疆温度降水配置演变及其尺度特征[J]. 气象学报, 2007,65(6):1003-1010. |
| [ Dai Xingang, Ren Yiyong, Chen Hongwu. Multi-scale feature of climate and climate shift in Xinjiang over the past 50 years[J]. Acta Meteorologica Sinica, 2007,65(6):1003-1010. ] | |
| [38] | 孔祥伟, 黄玉霞, 王勇. 1960—2010年宁夏降水和温度极端气候事件变化分析[J]. 安徽农业科学, 2014,42(9):2683-2688. |
| [ Kong Xiangwei, Huang Yuxia, Wang Yong. Changes in extreme climate events of precipitation and temperature in Ningxia from 1960 to 2010[J]. Journal of Anhui Agricultural Sciences, 2014,42(9):2683-2688. ] | |
| [39] | 郭梦瑶, 佘敦先, 张利平, 等. 渭河流域潜在蒸散量变化的气候归因[J]. 资源科学, 2020,42(5):907-919. |
| [ Guo Mengyao, She Dunxian, Zhang Liping, et al. Climate explanation of the potential evapotranspiration changes in Weihe River Basin[J]. Resources Science, 2020,42(5):907-919. ] | |
| [40] | 姬凯, 王士新, 左洪超, 等. 东亚副热带急流经向位置对中国西北东部盛夏降水的影响[J]. 干旱区研究, 2020,37(1):10-17. |
| [ Ji Kai, Wang Shixin, Zuo Hongchao, et al. Effect of meridional position of east asian subtropical jet on midsummer precipitation in eastern part of Northwest China[J]. Arid Zone Research, 2020,37(1):10-17. ] | |
| [41] | 杨金虎, 江志红, 刘晓芸, 等. 近半个世纪中国西北干湿演变及持续性特征分析[J]. 干旱区地理, 2012,35(1):10-22. |
| [ Yang Jinhu, Jiang Zhihong, Liu Xiaoyun, et al. Influence research on spring vegetation of Eurasia to summer drought-wetness over the northwest China[J]. Arid Land Geography, 2012,35(1):10-22. ] | |
| [42] | 徐影, 丁一汇, 赵宗慈. 人类活动引起的我国西北地区21世纪温度和降水变化情景分析[J]. 冰川冻土, 2003,25(3):327-330. |
| [ Xu Ying, Ding Yihui, Zhao Zongci. Scenario of temperature and precipitation changes in Northwest China due to human activity in the 21st century[J]. Journal of Glaciology and Geocryology, 2003,25(3):327-330. ] | |
| [43] | Duan G H, Chen D, Niu R Q. Forecasting groundwater level for soil landslide based on a dynamic model and landslide evolution pattern[J]. Water, 2019,11(10). DOI: 10.3390/w11102163. |
| [1] | 李小雨, 贾科利, 魏慧敏, 陈睿华, 王怡婧. 基于随机森林算法的土壤含盐量预测[J]. 干旱区研究, 2023, 40(8): 1258-1267. |
| [2] | 申红艳, 温婷婷, 赵仙荣, 冯晓莉. 基于多模式的青藏高原前冬降水预测性能评估[J]. 干旱区研究, 2023, 40(7): 1027-1039. |
| [3] | 张红丽, 韩富强, 张良, 王莉霞, 孙源, 李富民. 西北地区气候暖湿化空间与季节差异分析[J]. 干旱区研究, 2023, 40(4): 517-531. |
| [4] | 张雯, 马阳, 王岱, 杨建玲, 崔洋. 不同时间尺度海温因子对西北地区东部夏季降水的影响及预测[J]. 干旱区研究, 2023, 40(4): 532-542. |
| [5] | 李菲菲, 周霞, 周玉玺. 西北地区农业干旱脆弱性评估及时空分布特征[J]. 干旱区研究, 2023, 40(4): 663-669. |
| [6] | 李素雲,祁栋林,温婷婷,史飞飞,乔斌,肖建设. 1961—2020年青海省饱和水汽压差变化特征及影响因子分析[J]. 干旱区研究, 2023, 40(2): 173-181. |
| [7] | 贾琼, 宋孝玉, 宋淑红, 刘晓迪, 覃琳, 刘辉. 基于LMDI-SD耦合模型的关中地区水资源承载力动态预测与调控[J]. 干旱区研究, 2023, 40(12): 1918-1930. |
| [8] | 吴万民, 刘涛, 陈鑫. 西北干旱半干旱区NDVI季节性变化及其影响因素[J]. 干旱区研究, 2023, 40(12): 1969-1981. |
| [9] | 王娇娇, 尹小君, 刘陕南, 王帝盟. 基于深度学习的玛纳斯土地利用时空格局变化与预测[J]. 干旱区研究, 2023, 40(1): 69-77. |
| [10] | 贾玲,张百祖,牛最荣,孙栋元,孙凯悦,王鲁军. 疏勒河上游径流变化与预测分析[J]. 干旱区研究, 2022, 39(5): 1588-1597. |
| [11] | 蒋小芳,段翰晨,廖杰,宋翔,薛娴. 基于PLUS-SD耦合模型的黑河流域中游甘临高地区土地利用研究[J]. 干旱区研究, 2022, 39(4): 1246-1258. |
| [12] | 丁严,许德合,曹连海,管相荣. 基于CEEMD的LSTM和ARIMA模型干旱预测适用性研究——以新疆为例[J]. 干旱区研究, 2022, 39(3): 734-744. |
| [13] | 刘畅,张红,张霄羽,杨国婷,刘勇. 半干旱地区矿区土地利用时空演变与预测[J]. 干旱区研究, 2022, 39(1): 292-300. |
| [14] | 陈庭兴,吕海深,朱永华. 基于GEV分布的西营河流域洪水特性分析[J]. 干旱区研究, 2021, 38(6): 1563-1569. |
| [15] | 杨倩,秦莉,高培,张瑞波. 基于EEMD-LSTM模型的天山北坡经济带年降水量预测[J]. 干旱区研究, 2021, 38(5): 1235-1243. |
|
||