干旱区研究 ›› 2021, Vol. 38 ›› Issue (2): 293-302.doi: 10.13866/j.azr.2021.02.01 cstr: 32277.14.AZR.20210201
• 天气与气候 • 下一篇
刘彩红1( ),王朋岭2(),温婷婷1,余迪1,白文蓉1
收稿日期:2020-05-26
修回日期:2020-07-03
出版日期:2021-03-15
发布日期:2021-04-25
作者简介:刘彩红(1981-),女,博士,主要从事高原气候变化研究. E-mail:基金资助:
LIU Caihong1(),WANG Pengling2(),WEN Tingting1,YU Di1,BAI Wenrong1
Received:2020-05-26
Revised:2020-07-03
Published:2021-03-15
Online:2021-04-25
摘要:
黄河源区是气候变化敏感区及生态环境脆弱区,也是黄河的主要产流区,其气候变化问题备受关注。利用黄河源区均一化气温和降水观测数据,系统分析了近60 a黄河源区平均气候与极端气候事件的变化特征。结果表明:1960—2019年黄河源区年平均气温、平均最高及最低气温表现出增温趋势的一致性,且源区东部增温幅度高于西部;黄河源区年均气温在2000年前后发生突变转折,转折后升温速率达0.61 ℃·(10a)-1,高于1960—2019年的增温率0.37 ℃·(10a)-1。1960—2019年黄河源区年降水量总体呈微弱增加趋势[7.6 mm·(10a)-1],2003年后进入降水偏多阶段,近10 a(2010—2019年)源区平均年降水量达到610 mm;春、夏、冬季降水增多,秋季降水减少;其中源区东部夏、秋季降水减少明显,阶段性干旱风险加剧。近10 a源区平均气温、降水量均为60 a来最高值,总体处于最暖湿阶段。受持续暖湿化影响,1960—2019年黄河源区平均极端气温阈值呈显著的增大趋势,而霜冻日数减少;年最大3日降水量和强降水日数增多,降水强度增大,其中尤以夏季最为显著,对源区生态保护和水资源利用乃至黄河全流域高质量发展均可能带来风险挑战。
刘彩红,王朋岭,温婷婷,余迪,白文蓉. 1960—2019年黄河源区气候变化时空规律研究[J]. 干旱区研究, 2021, 38(2): 293-302.
LIU Caihong,WANG Pengling,WEN Tingting,YU Di,BAI Wenrong. Spatio-temporal characteristics of climate change in the Yellow River source area from 1960 to 2019[J]. Arid Zone Research, 2021, 38(2): 293-302.

图1
黄河源区气象站点分布"

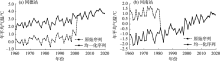
图2
1960—2019年同德站(a)和河南站(b)年平均气温均一化前后对比"

表1
极端气候指标"
| 极端气候指标 | 含义 | |
|---|---|---|
| 气温 | 暖日阈值/℃ | 日最高气温的第90%分位值 |
| 冷日阈值/℃ | 日最高气温的第10%分位值 | |
| 暖夜阈值/℃ | 日最低气温的第90%分位值 | |
| 冷夜阈值/℃ | 日最低气温小于10%分位值 | |
| 霜冻日数/d | 年内日最低温度低于0 ℃的天数 | |
| 降水 | 持续干期/d | 日降水量小于1 mm的最大持续日数 |
| 持续湿期/d | 日降水量大于1 mm的最大持续日数 | |
| 最大3日 降水量/mm | 最大连续3日总降水量 | |
| 强降水日数/mm | 日降水量大于有雨日90%分位值降水量的日数 | |
| 降水强度/(mm·d-1) | 有雨日降水量与有雨日数的比值 |
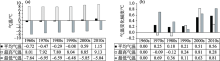
图3
1960—2019年黄河源区气温年代际变化(a)和变化幅度(b)"
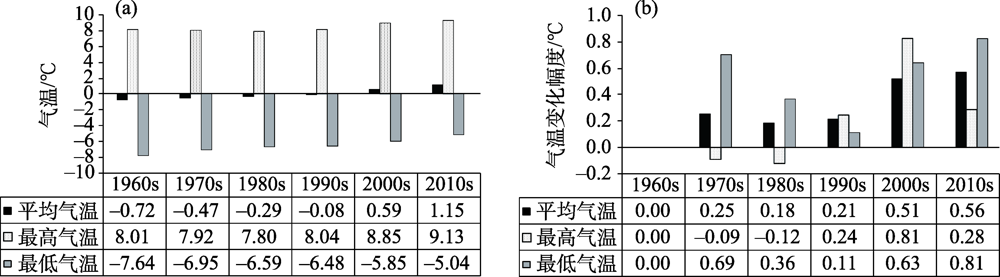
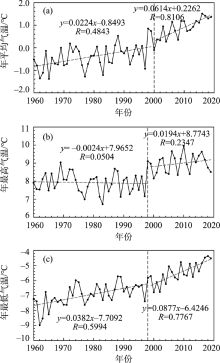
图4
1960—2019年黄河源区年平均气温(a)、平均最高(b)及最低气温(c)变化趋势"

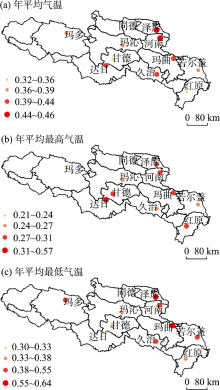
图5
1960—2019年黄河源区年平均气温(a)、平均最高(b)及最低气温(c)变化速率空间分布"

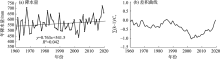
图6
1960—2019年黄河源区年降水量变化(a)及其差积曲线(b)"

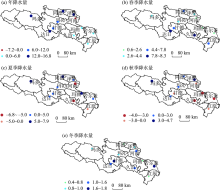
图7
1960—2019年年降水量(a)及春(b)、夏(c)、秋(d)、冬季(e)降水量变化趋势"

表2
1960—2019年黄河源区极端指标变化"
| 极端气温指标 | 变化速率 | 极端降水指标 | 变化速率 |
|---|---|---|---|
| 暖夜阈值/[℃·(10a)-1] | 0.37** | 持续干期/[d·(10a)-1] | -0.568 |
| 暖日阈值/[℃·(10a)-1] | 0.269** | 持续湿期/[d·(10a)-1] | -0.578 |
| 冷夜阈值/[℃·(10a)-1] | 0.917** | 最大3日降水量/[mm·(10a)-1] | 0.449** |
| 冷日阈值/[℃·(10a)-1] | 0.478** | 强降水日数/[d·(10a)-1] | 0.158 |
| 霜冻日数/[d·(10a)-1] | -8.479** | 降水强度/[mm·d-1·(10a)-1] | 0.059** |
| [1] | 姚檀栋, 邬光剑, 徐柏青, 等. “亚洲水塔”变化与影响[J]. 中国科学院院刊, 2019,34(11):1203-1209. |
| [ Yao Tandong, Wu Guangjian, Xu Boqing, et al. Asian water tower change and its impacts[J]. Bulletinof the Chinese Academy of Sciences, 2019,34(11):1203-1209. ] | |
| [2] | 李霞, 高艳红, 王婉昭, 等. 黄河源区气候变化与 GLDAS 数据适用性评估[J]. 地球科学进展, 2014,29(4):531-540. |
| [ Li Xia, Gao Yanhong, Wang Wanzhao, et al. Climate changes and applicability of GLDAS in the headwater of the Yellow River Basin[J]. Advances in Earth Science, 2014,29(4):531-540. ] | |
| [3] | 郝振纯, 王加虎, 李丽, 等. 气候变化对黄河源区水资源的影响[J]. 冰川冻土, 2006,28(1):1-7. |
| [ Hao Zhenchun, Wang Jiahu, Li Li, et al. Impact of climate change on water resources in the source region of the Yellow River[J]. Journal of Glaciology and Geocryology, 2006,28(1):1-7. ] | |
| [4] | 杨昭明, 白文蓉, 时兴合, 等. 黄河源区气温变化特征及预估分析[J]. 冰川冻土, 2019,41(4):818-827. |
| [ Yang Zhaoming, Bai Wenrong, Shi Xinghe, et al. Variation features and prediction of air temperature in the source regions of the Yellow River[J]. Journal of Glaciology and Geocryology, 2019,41(4):818-827. ] | |
| [5] | 马莲, 卢素锦, 司剑华, 等. 黄河源区1961-2017 降水序列趋势及突变识别[J]. 四川农业大学学报, 2019,37(6):842-851. |
| [ Ma Lian, Lu Sujin, Si Jianhua, et al. Trends and sudden change identification of precipitation series in the source region of the Yellow River from 1961 to 2017[J]. Journal of Sichuan Agricultural University, 2019,37(6):842-851. ] | |
| [6] | 乔士娇, 袁飞, 王妍. 黄河源区近50a极端气候变化趋势分析[J]. 人民黄河, 2015,37(5):20-23. |
| [ Qiao Shijiao, Yuan Fei, Wang Yan. Analysis of extreme climate change trends in the source area of the Yellow River in the past 50 years[J]. Yellow River, 2015,37(5):20-23. ] | |
| [7] | 刘光生, 王根绪, 胡宏昌, 等. 长江黄河源区近45年气候变化特征分析[J]. 资源科学, 2010,32(8):1486-1492. |
| [ Liu Guangsheng, Wang Genxu, Hu Hongchang, et al. Analysis of climate change in the source regions of the Yangtze River and the Yellow River in recent 45 years[J]. Resource Science, 2010,32(8):1486-1492. ] | |
| [8] | 马帅, 盛煜, 曹伟, 等. 黄河源区多年冻土空间分布变化特征数值模拟[J]. 地理学报, 2017,72(9):1621-1633. |
| [ Ma Shuai, Sheng Yu, Cao Wei, et al. Numerical simulation of spatial distribution of permafrost in the source region of the Yellow River[J]. Acta Geographica Sinica, 2017,72(9):1621-1633. ] | |
| [9] | 罗栋梁, 金会军, 吕兰芝, 等. 黄河源区多年冻土活动层和季节冻土冻融过程时空特征[J]. 科学通报, 2014,59(14):1327-1336. |
| [ Luo Dongliang, Jin Huijun, Lyu Lanzhi, et al. Temporal and spatial characteristics of permafrost active layer and seasonal frozen soil in the source region of the Yellow River[J]. Chinese Science Bulletin, 2014,59(14):1327-1336. ] | |
| [10] | 蒋宗立, 刘时银, 郭万钦, 等. 黄河源区阿尼玛卿山典型冰川表面高程近期变化[J]. 冰川冻土, 2018,40(2):231-237. |
| [ Jiang Zongli, Liu Shiying, Guo Wanqin, et al. Recent surface elevation changes of three representative glaciers in Ányêmaqên Mountains, source region of Yellow River[J]. Journal of Glaciology and Geocryology, 2018,40(2):231-237. ] | |
| [11] | 马守存, 保广裕, 郭广, 等. 1982-2013年黄河源区植被变化趋势及其对气候变化的响应[J]. 干旱气象, 2018,36(2):226-233. |
| [ Ma Shoucun, Bao Guangyu, Guo Guang, et al. Change trend of vegetation and its responses to climate change in the source region of the Yellow River[J]. Journal of Arid Meteorology, 2018,36(2):226-233. ] | |
| [12] | 康悦, 李振朝, 田辉, 等. 黄河源区植被变化趋势及其对气候变化的响应过程研究[J]. 气候与环境研究, 2011,16(4):505-512. |
| [ Kang Yue, Li Zhenchao, Tian Hui, et al. Trend of vegetation evaluation and its responses to climate change over the source region of the Yellow River[J]. Climatic and Environmental Research, 2011,16(4):505-512. ] | |
| [13] | 史丹丹, 杨涛, 胡金明, 等. 基于NDVI的黄河源区生长季植被时空变化及其与气候因子的关系[J]. 山地学报, 2018,36(2):184-193. |
| [ Shi Dandan, Yang Tao, Hu Jinming, et al. Temporal and spatial changes of vegetation in the growing season of the source region of the Yellow River based on NDVI and its relationship with climate factors[J]. Journal of Mountain Science, 2018,36(2):184-193. ] | |
| [14] | 王道席, 田世民, 蒋思齐, 等. 黄河源区径流演变研究进展[J]. 人民黄河, 2020,42(9):90-95. |
| [ Wang Daoxi, Tian Shimin, Jiang Siqi, et al. Research progress of the evolution of runoff in the source area of the Yellow River[J]. Yellow River, 2020,42(9):90-95. ] | |
| [15] | 郑子彦, 吕美霞, 马柱国. 黄河源区气候水文和植被覆盖变化及面临问题的对策建议[J]. 中国科学院院刊, 2020,35(1):61-72. |
| [ Zheng Ziyan, Lyu Meixia, Ma Zhuguo. Climate, hydrology, and vegetation coverage changes in source region of Yellow River and countermeasures for challenges[J]. Bulletin of the Chinese Academy of Sciences, 2020,35(1):61-72. ] | |
| [16] | 段水强, 范世雄, 曹广超, 等. 1976—2014年黄河源区湖泊变化特征及成因分析[J]. 冰川冻土, 2015,37(3):745-756. |
| [ Duan Shuiqiang, Fan Shixiong, Cao Guangchao, et al. The changing features and cause analysis of the lakes in the source regions of the Yellow River from 1976 to 2014[J]. Journal of Glaciology and Geocryology, 2015,37(3):745-56. ] | |
| [17] | 李林, 吴素霞, 朱西德, 等. 21世纪以来黄河源区高原湖泊群对气候变化的响应[J]. 自然资源学报, 2008,23(2):245-254. |
| [ Li Lin, Wu Suxia, Zhu Xide, et al. Response of plateau lakes in the source region of the Yellow River to climate change since the 21st Century[J]. Journal of Natural Resources, 2008,23(2):245-254. ] | |
| [18] | 王莺, 李耀辉, 孙旭映. 气候变化对黄河源区生态环境的影响[J]. 草业科学, 2015,32(4):539-551. |
| [ Wang Ying, Li Yaohui, Sun Xuying. Impact of climate change on the eco-environment in the Yellow River Source[J]. Pratacultural Science, 2015,32(4):539-551. ] | |
| [19] | 刘希胜, 李其江, 段水强, 等. 黄河源径流演变特征及其对降水的响应[J]. 中国沙漠, 2016,36(6):1721-1730. |
| [ Liu Xisheng, Li Qijiang, Duan Shuiqiang, et al. Evolution of the Yellow River Source runoff and its response to precipitation[J]. Journal of Desert Research, 2016,36(6):1721-1730. ] | |
| [20] | 朱丽, 刘蓉, 王欣, 等. 基于FLEXPART模式对黄河源区盛夏降水异常的水汽源地及输送特征研究[J]. 高原气象, 2019,38(3):484-496. |
| [ Zhu Li, Liu Rong, Wang Xin, et al. The characteristics of the water vapor transport and associated sources under abnormal precipitation conditions in the source region of the Yellow River using FLEXPAR[J]. Plateau Meteorology, 2019,38(3):484-496. ] | |
| [21] | 牛玉国, 张学成. 黄河源区水文水资源情势变化及其成因初析[J]. 人民黄河, 2005,27(3):31-33. |
| [ Niu Yuguo, Zhang Xuecheng. Preliminary analysis on variations of hydrologic and water resources regime and its genesis of the Yellow River source region[J]. Yellow River, 2005,27(3):31-33. ] | |
| [22] | 蓝永超, 鲁承阳, 喇承芳, 等. 黄河源区气候向暖湿转变的观测事实及其水文响应[J]. 冰川冻土, 2013,35(4):920-928. |
| [ Lan Yongchao, Lu Chengyang, La Chenfang, et al. The fact to climate shift to warm-humid in the source regions of the Yellow River and its hydrologic response[J]. Journal of Glaciology and Geocryology, 2013,35(4):920-928. ] | |
| [23] | 曹丽娟, 严中伟. 地面气候资料均一性研究进展[J]. 气候变化研究进展, 2011,7(2):129-135. |
| [ Cao Lijuan, Yan Zhongwei. Progress in research of homogenization of climate data[J]. Advances in Climate Change Research, 2011,7(2):129-135. ] | |
| [24] | Cao L J, Zhu Y N, Tang G L, et al. Climatic warming in China according to a homogenized data set from 2419 stations[J]. International Journal of Climatology, 2016,36:4384-4392. |
| [25] | Climatic Research Unit, School of Environmental Sciences, University of East Anglia. Statistical and regional dynamical downscaling of extremes for European regions[EB]. [2005-11-01]. http://www.cru.uea.ac.uk/projects/stardex. |
| [26] | 魏凤英. 现代气候统计诊断与预测技术[M]. 北京: 气象出版社, 2007: 37-55. |
| [ Wei Feiying. Modern Climate Statistical Diagnosis and Prediction Technology[M]. Beijing: Meteorological Press, 2007: 37-55. ] | |
| [27] | 石明星, 蓝永超, 沈永平, 等. 1961-2014年黄河源区蒸发皿蒸发量变化的多尺度特征及突变分析[J]. 冰川冻土, 2018,40(4):666-675. |
| [ Shi Mingxing, Lan Yongchao, Shen Yongping, et al. Analyses of multiple time scales characteristics and mutation of pan evaporation variation in the source regions of the Yellow River from 1961 to 2014[J]. Journal of Glaciology and Geocryology, 2018,40(4):666-675. ] | |
| [28] | 李林, 李凤霞, 郭安红. 近43年来“三江源”地区气候变化趋势及其突变研究[J]. 自然资源学报, 2006,21(1):79-86. |
| [ Li Lin, Li Fengxia, Guo Anhong. Study on climate change trends and abrupt changes in the “Three River Sources” in the past 43 years[J]. Journal of Natural Resources, 2006,21(1):79-86. ] | |
| [29] | 李开明, 李绚, 王翠云, 等. 黄河源区气候变化的环境效应研究[J]. 冰川冻土, 2013,35(5):1183-1192. |
| [ Li Kaiming, Li Xu, Wang Cuiyun, et al. Research on the environmental effect caused by climate change in the source region of the Yellow River[J]. Journal of Glaciology and Geocryology, 2013,35(5):1183-1192. ] | |
| [30] | Zhou Y K. Characterizing the spatiotemporal dynamics and variability in climate extremes over the Tibetan Plateau during 1960-2012[J]. Journal of Resources and Ecology, 2019,10(4):397-414. |
| [31] | 尹红, 孙颖. 基于ETCCDI指数2017年中国极端温度和降水特征分析[J]. 气候变化研究进展, 2019,15(4):363-373. |
| [ Yin Hong, Sun Yin. Characteristics of extreme temperature and precipitation in China in 2017 based on ETCCDI indices[J]. Climate Change Research, 2019,15(4):363-373. ] | |
| [32] | 王婷婷, 冯起, 李宗省, 等. 1960—2012年祁连山东段古浪河流域极端气候事件研究[J]. 冰川冻土, 2018,40(3):598-606. |
| [ Wang Tinging, Feng Qi, Li Zongxing, et al. Extreme climate research on Gulang River basin in eastern Qilian Mountains during 1960-2012[J]. Journal of Glaciology and Geocryology, 2018,40(3):598-606. ] | |
| [33] | 刘彩红, 余锦华, 李红梅. RCPs情景下未来青海高原气候变化趋势预估[J]. 中国沙漠, 2015,35(5):1353-1361. |
| [ Liu Caihong, Yu Jinhua, Li Hongmei. Prediction of future climate change trends on the Qinghai Plateau under RCPs scenarios[J]. Journal of Desert Research, 2015,35(5):1353-1361. ] | |
| [34] | 徐集云, 石英, 高学杰, 等. RegCM3对中国 21 世纪极端气候事件变化的高分辨率模拟[J]. 科学通报, 2013,58(8):724-733. |
| [ Xu Jiyun, Shi Ying, Gao Xuejie, et al. RegCM3 high-resolution simulation of extreme climate events in China in the 21st century[J]. Chinese Science Bulletin, 2013,58(8):724-733. ] | |
| [35] | 李红梅, 李林, 张金旭, 等. 21世纪前中期三江源地区极端气候事件变化趋势分析[J]. 冰川冻土, 2012,34(6):1403-1408. |
| [ Li Hongmei, Li Lin, Zhang Jinxu, et al. Change in extreme climatic events over the sources of the three rivers in the prometaphase 21st century[J]. Journal of Glaciology and Geocryology, 2012,34(6):1403-1408. ] | |
| [36] | 中国气象局气候变化中心. 中国气候变化蓝皮书(2020)[M]. 北京: 科学出版社, 2020: 11-25. |
| [ CMA Climate Change Center. Blue Book on Climate Change in China (2020)[M]. Beijing: Science Press, 2020: 11-25. ] | |
| [37] | 李林, 李红梅, 申红艳, 等. 青藏高原气候变化的若干事实及其年际振荡的成因探讨[J]. 冰川冻土, 2018,40(6):1079-1089. |
| [ Li Lin, Li Hongmei, Shen Hongyan, et al. The truth and interannual oscillation causes for climate change in the Qinghai-Tibet Plateau[J]. Journal of Glaciology and Geocryology, 2018,40(6):1079-1089. ] | |
| [38] | 蓝永超, 朱云迪, 刘根生, 等. 黄河源区气候变化的季节特征与区域差异研究[J]. 冰川冻土, 2016,38(3):741-749. |
| [ Lan Yongchao, Zhu Yundi, Liu Gensheng, et al. Study of the seasonal characteristics and regional differences of climate change in source regions of the Yellow River[J]. Journal of Glaciology and Geocryology, 2016,38(3):741-749. ] | |
| [39] | Iqbal M, Wen J, Wang X, et al. Assessment of air temperature trends in the source region of Yellow River and its sub-basins, China[J]. Asia-pacific Journal of Atmospheric Sciences, 2018,54(1), 111-123. |
| [40] | Li Q, Yang M X, Wan G N, et al. Spatial and temporal precipitation variability in the source region of the Yellow River[J]. Environmental Earth Sciences, 2016,75(7):594. |
| [41] | Wang Q, Zhai P M, Qin D H. New perspectives on ‘warming-wetting’ trend in Xinjiang, China[J]. Advance in Climate Change Research, 2020,11(3):252-260. |
| [42] | Zhang Q, Lin J, Liu W, et al. Precipitation seesaw phenomenon and its formation mechanism in the eastern and western parts of Northwest China during the flood season[J]. Science China Earth Sciences, 2019,62(12), 2083-2098. |
| [43] | Jiang P, Yu Z B, Yuan F F, et al. The multi-Scale temporal variability of extreme precipitation in the source region of the Yellow River[J]. Water, 2019,11(1), 92-94. |
| [44] | Wu P, Ding Y L, Liu Y J, et al. The characteristics of moisture recycling and its impact on regional precipitation against the background of climate warming over Northwest China[J]. International Journal of Climatology, 2019,39(14):5241-5255. |
| [45] | 祁艳, 颜玉倩, 李金海, 等. 青藏高原5-10月地表潜热通量与青海同期降水之间的关系[J]. 干旱区研究, 2019,36(3):529-536. |
| [ Qi Yan, Yan Yuqian, Li Jinhai, et al. Relationship between surface latent heat flux over the Qinghai Tibetan Plateau and precipitation in Qinghai from May to October[J]. Arid Zone Research, 2019,36(3):529-536. ] | |
| [46] | 杨昭明, 张调风. 1961—2017年青藏高原东北部雨季降水量变化及其贡献度分析[J]. 干旱区研究, 2021,38(1):22-28. |
| [ Yang Zhaoming, Zhang Tiaofeng. Analysis of rainy season rainfall change and its contribution in the Northeast of Qinghai-Tibet Plateau from 1961 to 2017[J]. Arid Zone Research, 2021,38(1):22-28. ] | |
| [47] | Cheng L J, Abraham J, Zhu J, et al. Record-setting ocean warmth continued in 2019[J]. Advances in Atmospheric Sciences, 2020,37(2):137-142. |
| [48] | Duan A M, Xiao Z N. Does the climate warming hiatus exist over the Tibetan Plateau?[J]. Scientific Reports, 2015,5:13711. |
| [49] | Meng F C, Su F G, Yang D Q, et al. Impacts of recent climate change on the hydrology in the source region of the Yellow River basin[J]. Journal of Hydrology: Regional Studies, 2016,6:66-81. |
| [50] | 效存德, 苏勃, 王晓明, 等. 冰冻圈功能及其服务衰退的级联风险[J]. 科学通报, 2019,64(19):1975-1984. |
| [ Xiao Cunde, Su Bo, Wang Xiaoming, et al. Cascading risks to the deterioration in cryospheric functions and services[J]. Chinese Science Bulletin, 2019,64(19):1975-1984. ] |
| [1] | 李宇航, 余文学, 杨永均, 朱燕峰, 马静, 陈浮. 近60 a天山北坡经济带天然径流量时空变化及归因识别[J]. 干旱区研究, 2024, 41(9): 1446-1455. |
| [2] | 吕壮壮, 乔庆庆, 董孙艺, 汪冬. 中中新世气候适宜期全球变暖背景下亚洲内陆干旱区古气候演化特征及驱动机制[J]. 干旱区研究, 2024, 41(8): 1309-1322. |
| [3] | 周杰, 王旭虎, 杜维波, 周晓雷, 杨洁, 张晓玮. 气候变化背景下的天山云杉潜在分布区预测[J]. 干旱区研究, 2024, 41(7): 1167-1176. |
| [4] | 梁双河, 牛最荣, 贾玲. 祖厉河干流近65 a径流变化及归因分析[J]. 干旱区研究, 2024, 41(6): 928-939. |
| [5] | 唐可欣, 郭建斌, 何亮, 陈林, 万龙. 中国旱区GPP时空演变特征及影响因素研究[J]. 干旱区研究, 2024, 41(6): 964-973. |
| [6] | 山建安, 朱睿, 尹振良, 杨华庆, 张薇, 方春爽. 基于CMIP6模式的中国西北地区干旱时空变化[J]. 干旱区研究, 2024, 41(5): 717-729. |
| [7] | 张嘉琪, 刘招, 韩忠青, 王丽霞, 张晋霞, 岳甲寅, 管子隆. 气候变化下泾河流域蓝绿水变化趋势及预测[J]. 干旱区研究, 2024, 41(12): 2045-2055. |
| [8] | 张倩, 曹广超, 张乐乐, 赵美亮. 祁连山南坡植被绿度时空变化及其对气候变化和人类活动的响应[J]. 干旱区研究, 2024, 41(12): 2143-2153. |
| [9] | 胡广录, 樊亚仑, 陶虎, 李昊辰, 杨鹏华. 石羊河下游蔡旗站径流变化趋势及影响因素[J]. 干旱区研究, 2024, 41(11): 1842-1852. |
| [10] | 杨斐, 张文韬, 张飞民, 王澄海. 1961—2022年祁连山气候特征及其变化[J]. 干旱区研究, 2024, 41(10): 1627-1638. |
| [11] | 张音, 孙从建, 刘庚, 钞锦龙, 耿甜伟. 近20 a塔里木河流域山区NDSI对气候变化的响应[J]. 干旱区研究, 2024, 41(10): 1639-1648. |
| [12] | 程倩, 齐月, 刘明春, 张鹏, 丁文魁, 李兴宇, 任丽雯, 杨华. 气候变化及人类活动背景下石羊河流域生态与水资源变化特征[J]. 干旱区研究, 2024, 41(10): 1672-1684. |
| [13] | 樊玉科, 任菊, 王润龙, 周栋栋, 潘自凯, 张晓玮, 周晓雷. 气候变化背景下白皮松在中国潜在适宜分布预测[J]. 干旱区研究, 2024, 41(10): 1719-1730. |
| [14] | 齐容镰, 李庆波, 任佳, 邹苗, 杨昊鹏, 魏耀峰, 唐琼. “三北”工程地区植被覆盖变化特征及其驱动力分析——以宁夏为例[J]. 干旱区研究, 2024, 41(10): 1740-1752. |
| [15] | 赵雨琪, 魏天兴. 1990—2020年黄土高原典型县域植被覆盖变化及影响因素[J]. 干旱区研究, 2024, 41(1): 147-156. |
|
||