干旱区研究 ›› 2025, Vol. 42 ›› Issue (11): 2058-2070.doi: 10.13866/j.azr.2025.11.09
王慧1( ), 刘若曦1, 徐维新1,2(), 郑照军3, 校瑞香4, 李蕙君1, 吴成娜1
收稿日期:2025-05-12
修回日期:2025-10-08
出版日期:2025-11-15
发布日期:2025-12-13
通讯作者:
徐维新. E-mail: weixin.xu@cuit.edu.cn作者简介:王慧(2002-),女,主要从事积雪遥感监测与变化研究. E-mail: 13980867805@163.com
基金资助:
WANG Hui1(), LIU Ruoxi1, XU Weixin1,2(), ZHENG Zhaojun3, XIAO Ruixiang4, LI Huijun1, WU Chengna1
Received:2025-05-12
Revised:2025-10-08
Published:2025-11-15
Online:2025-12-13
摘要: 卫星时相的季节性差异,可直接影响冰川多年变化趋势研究的准确性。利用2000—2023年暖季(6—9月)逐日MODIS影像,通过逐日积雪面积序列与冰川区逐年最小积雪面积建立统一对比标准,评估时相偏差对冰川时序变化的影响程度,分析冰川区积雪面积多年动态变化特征。结果表明:(1) 卫星影像时相偏差导致冰川面积估算偏差最高可达-23.25%,即使时相处于6—9月期间,偏差仍可达到7.75%。(2) 在消除时相偏差的影响后,发现已有的针对各拉丹东与阿尼玛卿地区冰川变化的研究结果,明显低估了近20 a来冰川变化的下降趋势,其中阿尼玛卿冰川面积缩减率达到17.03%,高于原有的认识。(3) 基于2000—2023年最小积雪面积时间序列,近24 a各拉丹东冰川区年缩减率为0.24%·a-1(累计减少5.42%),阿尼玛卿冰川区为0.43%·a-1(累计减少9.82%),各拉丹东冰川区年最小积雪面积下降趋势显著,而阿尼玛卿冰川区下降趋势不明显,这与已有的认识不同。(4) 以两个冰川区为典型代表,青藏高原腹地冰川区积雪面积通常在8月中上旬达到最小值,选取该时期或临近2旬的卫星影像,时相偏差一般小于0.5%,选择6月初或9月底的卫星影像,时相偏差可能带来12%以上的结果偏差,且6月的影像时相偏差一般小于9月。
王慧, 刘若曦, 徐维新, 郑照军, 校瑞香, 李蕙君, 吴成娜. 时相偏差对多年冰川变化研究的影响[J]. 干旱区研究, 2025, 42(11): 2058-2070.
WANG Hui, LIU Ruoxi, XU Weixin, ZHENG Zhaojun, XIAO Ruixiang, LI Huijun, WU Chengna. Impact of temporal phase bias on multiyear glacier changes[J]. Arid Zone Research, 2025, 42(11): 2058-2070.
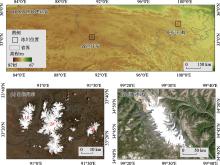
图1
研究区(a)及各拉丹东(b)与阿尼玛卿(c)冰川区地理位置示意图 注:底图采用国家地理信息公共服务平台标准地图制作,审图号为GS(2024)0650号,对底图边界无修改。"

表1
已有研究中所采用的2000年以来Landsat卫星影像及其时相"
| 冰川名称 | 数据集 | 数据日期/年-月-日 |
|---|---|---|
| 各拉丹东 | Landsat 5 TM | 2001-10-27 |
| 2009-08-30 | ||
| Landsat 8 OLI | 2015-10-12 | |
| 各拉丹东 | Landsat 5 TM | 2000-08-21 |
| 2006-08-06 | ||
| Landsat 8 OLI | 2013-08-09 | |
| 阿尼玛卿 | Landsat ETM+ | 2001-08-13 |
| Landsat TM | 2009-08-11 | |
| Landsat ETM+ | 2017-08-09 |
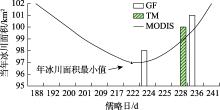
图2
基于逐日数据的MODIS冰川区年最小积雪面积提取及不同卫星时相分布"

表2
MODIS冰川监测模式判识结果的混淆矩阵与精度检验"
| TM真值 | 非冰川 | 冰川 | 合计 | 生产精度 | 用户精度 | 总体精度 | Kappa系数 |
|---|---|---|---|---|---|---|---|
| 模式判识 | |||||||
| 非冰川 | 36089 | 201 | 36290 | 97.36 | 99.45 | 97.14% | 0.85 |
| 冰川 | 977 | 3944 | 4921 | 95.15 | 80.15 |
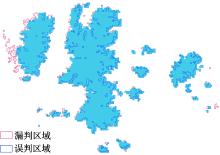
图3
2008年8月11日MODIS各拉丹东冰川区积雪面积判识结果及误判与漏判区域"

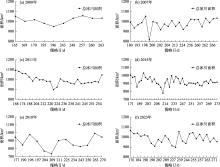
图4
基于MODIS数据的各拉丹东冰川区年最小冰川区积雪面积提取"

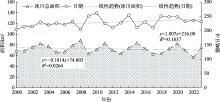
图5
2000—2023年阿尼玛卿冰川区最小积雪面积变化时间序列及线性趋势"

表3
冰川区积雪面积时相偏差修正"
| 冰川名称 | 文献 | Landsat | MODIS年最小积雪面积出现儒略日/d | 偏差率/% | 修正面积/km2 | ||
|---|---|---|---|---|---|---|---|
| 日期/年-月-日 | 儒略日/d | 面积/km2 | |||||
| 各拉丹东 各拉丹东 | [8] | 2001-10-27 | 300 | 937.15 | 201 | 7.23 | 878.23 |
| 2009-08-30 | 242 | 924.04 | 234 | 2.53 | 868.21 | ||
| 2015-10-12 | 285 | 905.41 | 212 | 6.72 | 732.42 | ||
| [9] | 2000-08-21 | 234 | 825.63 | 196 | -23.25 | 1239.04 | |
| 2006-08-06 | 218 | 814.09 | 217 | -3.97 | 903.21 | ||
| 2013-08-09 | 221 | 800.68 | 211 | 7.75 | 834.66 | ||
| 阿尼玛卿 | [7] | 2001-08-13 | 225 | 108.70 | 213 | -18.42 | 84.51 |
| 2009-08-11 | 223 | 102.60 | 251 | -10.36 | 70.98 | ||
| 2017-08-09 | 221 | 94.50 | 210 | -9.90 | 70.12 | ||
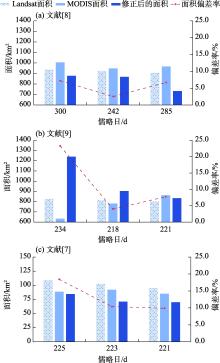
图6
基于时相偏差修订的文献(a)、(b)、(c)中2000—2017年间重叠日期冰川面积及偏差率"
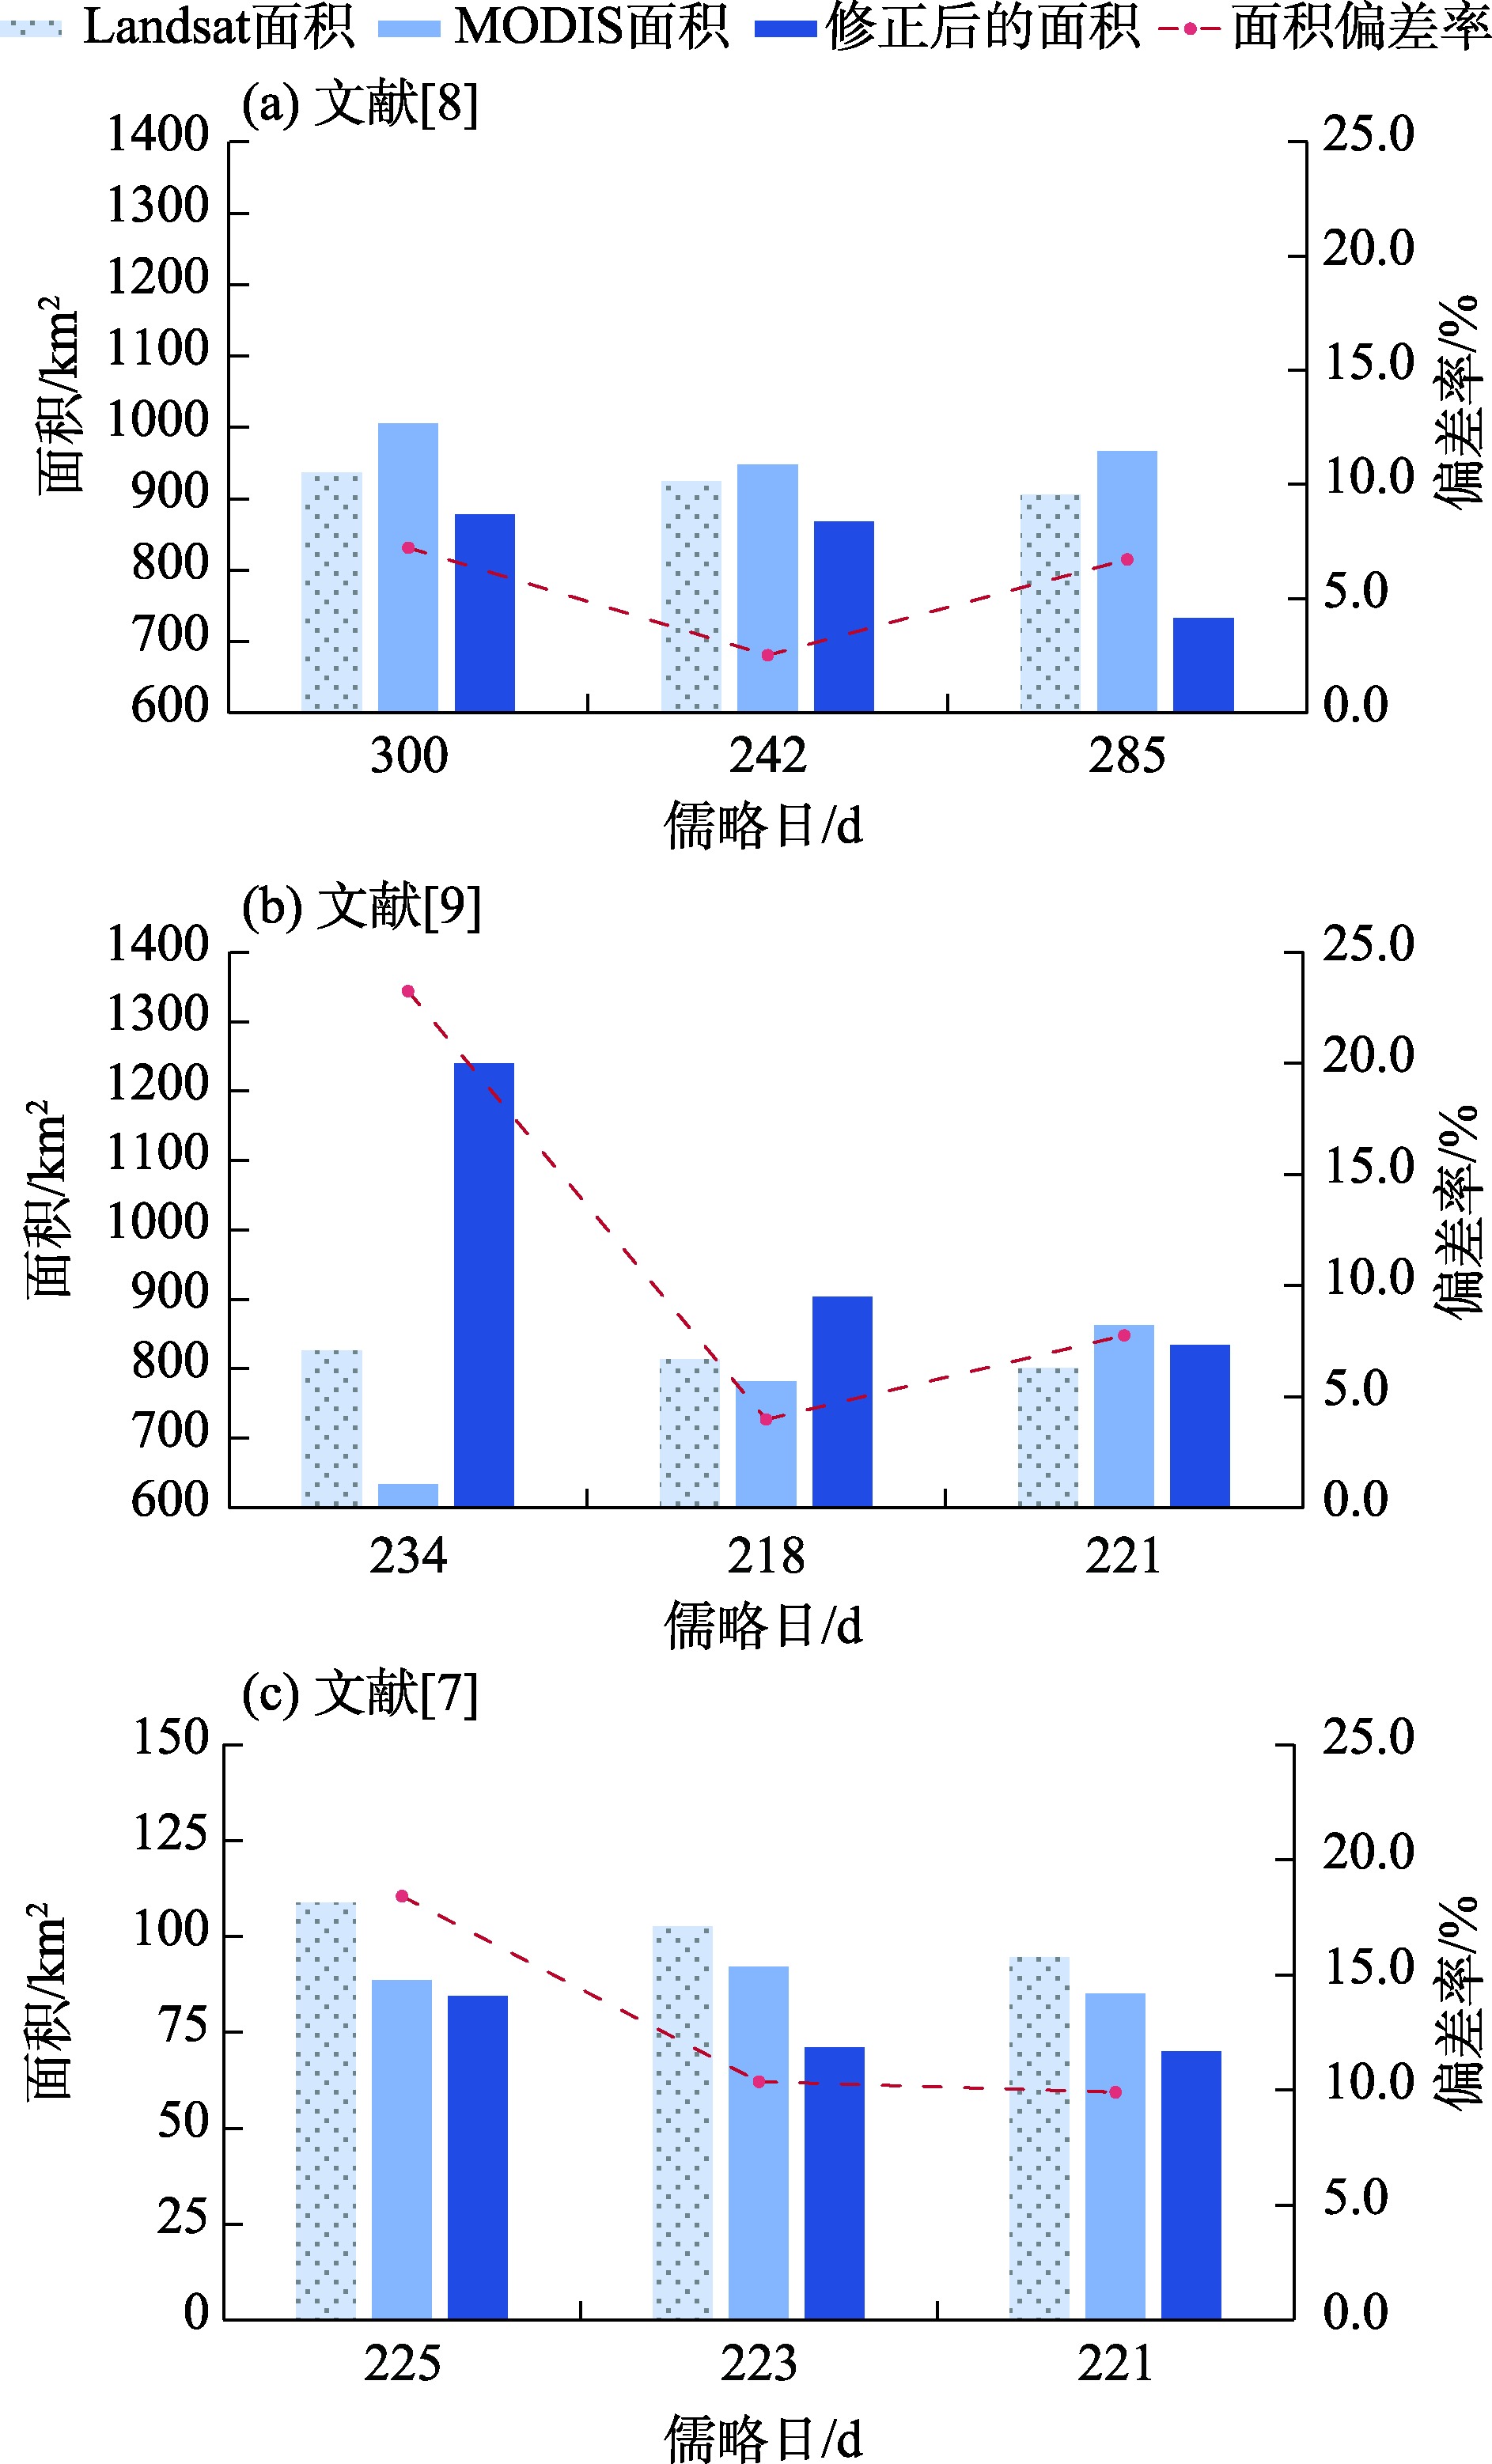
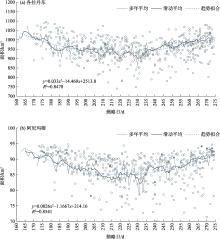
图7
2000—2023年6—9月各拉丹东(a)与阿尼玛卿(b)冰川区晴空日积雪面积及其多年平均、5 d滑动平均与时间趋势拟合"

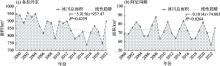
图8
2000—2023年各拉丹东(a)及阿尼玛卿(b)冰川区积雪面积与变化趋势"

| [1] | 周秉荣, 袁佳双, 乔斌, 等. 青藏高原气候与冰冻圈变化研究进展[J]. 环境科学研究, 2024, 37(9): 1885-1896. |
| [ Zhou Bingrong, Yuan Jiashuang, Qiao Bin, et al. Research progress on climate and cryosphere changes in the Qinghai-Xizang Plateau[J]. Research of Environmental Sciences, 2024, 37(9): 1885-1896. ] | |
| [2] | 董锁成, 周长进, 王海英. “三江源”地区主要生态环境问题与对策[J]. 自然资源学报, 2002, 17(6): 713-720. |
| [ Dong Suocheng, Zhou Changjin, Wang Haiying. Ecological crisis and countermeasures of the Three Rivers’ Headstream Regions[J]. Journal of Natural Resources, 2002, 17(6): 713-720. ] | |
| [3] | 刘程辉, 王文宇. 顾及NDSI的三江源地区生态环境质量监测及动态分析[J]. 北京建筑大学学报, 2022, 38(6): 68-76. |
| [ Liu Chenghui, Wang Wenyu. Dynamic analysis and monitoring ecological environment quality in the Sanjiang Source Region based on RSEI considering NDSI[J]. Journal of Beijing University of Civil Engineering and Architecture, 2022, 38(6): 68-76. ] | |
| [4] | 陈发虎, 谢亭亭, 杨钰杰, 等. 我国西北干旱区“暖湿化”问题及其未来趋势讨论[J]. 中国科学: 地球科学, 2023, 53(6): 1246-1262. |
| [ Chen Fahu, Xie Tingting, Yang Yujie, et al. Discussion of the “warming and wetting” trend and its future variation in the drylands of Northwest China under global warming[J]. Science China Earth Sciences, 2023, 53(6): 1246-1262. ] | |
| [5] | 刘时银, 郭万钦, 许君利. 中国第二次冰川编目数据集(V1.0)[DB/OL]. 国家青藏高原科学数据中心, 2021. |
| [ Liu Shiyin, Guo Wanqin, Xu Junli. The second glacial catalogue data set of China (v1.0)[DB/OL]. National Tibetan Plateau/Third Pole Environment Data Center, 2021. ] | |
| [6] |
李红梅, 颜亮东, 温婷婷, 等. 三江源地区气候变化特征及其影响评估[J]. 高原气象, 2022, 41(2): 306-316.
doi: 10.7522/j.issn.1000-0534.2021.00101 |
|
[ Li Hongmei, Yan Liangdong, Wen Tingting, et al. Characteristics of climate change and its impact assessment in the Three-River Regions[J]. Plateau Meteorology, 2022, 41(2): 306-316. ]
doi: 10.7522/j.issn.1000-0534.2021.00101 |
|
| [7] |
Li K J, Cao B, Guan W J, et al. Reconstructed annual glacier surface mass balance in the Ányêmaqên Mountains, Yellow River source, based on snow line altitude[J]. Journal of Mountain Science, 2022, 19(4): 1070-1081.
doi: 10.1007/s11629-021-7157-9 |
| [8] |
李晨毓, 井哲帆, 何晓波. 1986—2015年长江源各拉丹冬地区冰川变化遥感监测研究[J]. 冰川冻土, 2021, 43(2): 405-416.
doi: 10.7522/j.issn.1000-0240.2021.0136 |
|
[ Li Chenyu, Jing Zhefan, He Xiaobo. Remote sensing monitoring of glacier variation in Geladandong,source regions of the Yangtze River from 1986 to 2015[J]. Journal of Glaciology and Geocryology, 2021, 43(2): 405-416. ]
doi: 10.7522/j.issn.1000-0240.2021.0136 |
|
| [9] |
Xu J L, Shangguan D H, Wang J. Three-Dimensional glacier changes in Geladandong Peak Region in the central Tibetan Plateau[J]. Water, 2018, 10(12): 1749.
doi: 10.3390/w10121749 |
| [10] | 韩帅, 刘浩成, 黄鑫华. 近30年各拉丹东冰川变化及对径流的影响[J]. 青海大学学报, 2021, 39(3): 9-17. |
| [ Han Shuai, Liu Haocheng, Huang Xinhua. Glacier variations in Geladandong and its impact on the runoff in recent 30 years[J]. Journal of Qinghai University, 2021, 39(3): 9-17. ] | |
| [11] |
金姗姗, 张永红, 吴宏安. 近40 a长江源各拉丹冬冰川进退变化研究[J]. 自然资源学报, 2013, 28(12): 2095-2104.
doi: 10.11849/zrzyxb.2013.12.007 |
|
[ Jin Shanshan, Zhang Yonghong, Wu Hongan. Study on glacial advancement and retreatment in Geladandong Region of Changjiangyuan in recent 40 years[J]. Journal of Natural Resources, 2013, 28(12): 2095-2104. ]
doi: 10.11849/zrzyxb.2013.12.007 |
|
| [12] | 金姗姗, 付姣. 基于多时相Landsat TM/ETM的阿尼玛卿山冰川变化监测[J]. 北京测绘, 2013(1): 20-23, 10. |
| [ Jin Shanshan, Fu Jiao. Detection of the glacial changes in Animaqingshan Area based on Landsat TM/ETM images[J]. Beijing Surveying and Mapping, 2013(1): 20-23, 10. ] | |
| [13] | 拉巴卓玛, 喻薛凝. 1976—2019年西藏杰玛央宗冰川变化遥感监测[J]. 高原科学研究, 2020, 4(3): 17-29, 54. |
| [ Lhakpa Drolma, Yu Xuening. Study on the variation of Chema Yongdrung Glacier in Xizang using remote sensing during 1976-2019[J]. Plateau Science Research, 2020, 4(3): 17-29, 54. ] | |
| [14] |
Ma B R, Xie Y X, Zhang T Z, et al. Identification of conflict between wildlife living spaces and human activity spaces and adjustments in/around protected areas under climate change: A case study in the Three-River Source Region[J]. Journal of Environmental Management, 2020, 262: 110322.
doi: 10.1016/j.jenvman.2020.110322 |
| [15] | 张立芸, 唐亚, 杨欣. 1969—2012年长江源各拉丹冬地区主要冰川整体和局部变化及其对气候变化的响应[J]. 干旱区地理, 2014, 37(2): 212-221. |
| [ Zhang Liyun, Tang Ya, Yang Xin. Overall and local changing patterns of main glaciers and their responses to climate change in Geladandong area of Yangtze Headwater region during 1969-2012[J]. Arid Land Geography, 2014, 37(2): 212-221. ] | |
| [16] | 黄鑫华, 孟庆凯, 刘浩成. 基于GEE的阿尼玛卿冰川面积遥感监测及潜在灾害初步分析[J]. 青海大学学报, 2023, 41(3): 1-7. |
| [ Huang Xinhua, Meng Qingkai, Liu Haocheng. Remote sensing monitoring of Anyemaqen glacier area based on GEE and preliminary analysis of potential hazards[J]. Journal of Qinghai University, 2023, 41(3): 1-7. ] | |
| [17] | 王凯, 杨太保, 何毅, 等. 近30年阿尼玛卿山冰川与气候变化关系研究[J]. 水土保持研究, 2015, 22(3): 300-303, 308. |
| [ Wang Kai, Yang Taibao, He Yi, et al. Research for glaciers and climate change of Aʹnyê Maqên Mountain nearly 30 years[J]. Research of Soil and Water Conservation, 2015, 22(3): 300-303, 308. ] | |
| [18] | 梁天刚, 高新华, 黄晓东, 等. 新疆北部MODIS积雪制图算法的分类精度[J]. 干旱区研究, 2007, 24(4): 446-452. |
| [ Liang Tiangang, Gao Xinhua, Huang Xiaodong, et al. Study on the accuracy of MODIS snow cover mapping algorithm in northern Xinjiang[J]. Arid Zone Research, 2007, 24(4): 446-452. ] | |
| [19] |
别强, 强文丽, 王超, 等. 1960—2010年黑河流域冰川变化的遥感监测[J]. 冰川冻土, 2013, 35(3): 574-582.
doi: 10.7522/j.issn.1000-0240.2013.0066 |
|
[ Bie Qiang, Qiang Wenli, Wang Chao, et al. Monitoring glacier variation in the upper reaches of the Heihe River based on remote sensing in 1960-2010[J]. Journal of Glaciology and Geocryology, 2013, 35(3): 574-582. ]
doi: 10.7522/j.issn.1000-0240.2013.0066 |
|
| [20] |
田梦祺, 段克勤, 石培宏. 基于Google Earth Engine平台的青藏高原冰川变化研究——以普若岗日冰原为例[J]. 地理科学, 2023, 43(6): 943-951.
doi: 10.13249/j.cnki.sgs.2023.06.001 |
|
[ Tian Mengqi, Duan Keqin, Shi Peihong. Glacier changes on the Qinghai-Xizang Plateau based on Google Earth Engine: A case study of the Purog Kangri glacier[J]. Scientia Geographica Sinica, 2023, 43(6): 943-951. ]
doi: 10.13249/j.cnki.sgs.2023.06.001 |
|
| [21] |
高扬, 郝晓华, 和栋材, 等. 基于不同土地覆盖类型NDSI阈值优化下的青藏高原积雪判别[J]. 冰川冻土, 2019, 41(5): 1162-1172.
doi: 10.7522/j.issn.1000-0240.2019.1155 |
|
[ Gao Yang, Hao Xiaohua, He Dongcai, et al. Snow cover mapping algorithm in the Tibetan Plateau based on NDSI threshold optimization of different land cover types[J]. Journal of Glaciology and Geocryology, 2019, 41(5): 1162-1172. ]
doi: 10.7522/j.issn.1000-0240.2019.1155 |
|
| [22] |
张音, 孙从建, 刘庚, 等. 近20 a塔里木河流域山区NDSI对气候变化的响应[J]. 干旱区研究, 2024, 41(10): 1639-1648.
doi: 10.13866/j.azr.2024.10.03 |
|
[ Zhang Yin, Sun Congjian, Liu Geng, et al. Response of NDSI in the Tarim River Basin mountainous areas to climate change over the past 20 years[J]. Arid Zone Research, 2024, 41(10): 1639-1648. ]
doi: 10.13866/j.azr.2024.10.03 |
|
| [23] |
Zhang H B, Zhang F, Zhang G Q, et al. Ground-based evaluation of MODIS snow cover product V6 across China: Implications for the selection of NDSI threshold[J]. Science of the Total Environment, 2019, 651: 2712-2726.
doi: 10.1016/j.scitotenv.2018.10.128 |
| [24] |
谢佩瑶, 韩超, 欧阳志棋, 等. 青藏高原不同土地覆盖类型下积雪面积判别算法优化[J]. 冰川冻土, 2023, 45(3): 1168-1179.
doi: 10.7522/j.issn.1000-0240.2022.0364 |
|
[ Xie Peiyao, Han Chao, Ouyang Zhiqi, et al. Optimization of snow area discrimination algorithm under different land cover types in Qinghai-Xizang Plateau[J]. Journal of Glaciology and Geocryology, 2023, 45(3): 1168-1179. ]
doi: 10.7522/j.issn.1000-0240.2022.0364 |
|
| [25] | 王玮. 青藏高原牧区积雪监测研究[D]. 兰州: 兰州大学, 2011. |
| [ Wang Wei. Monitoring Snow Cover in Pastoral Areas on Qinghai-Xizang Plateau[D]. Lanzhou: Lanzhou University, 2011. ] | |
| [26] | 王雪璐, 王玮, 冯琦胜, 等. 基于MODIS数据的青海省积雪覆盖范围监测算法探索[J]. 草业学报, 2012, 21(4): 293-299. |
| [ Wang Xuelu, Wang Wei, Feng Qisheng, et al. A snow cover mapping algorithm based on MODIS data in Qinghai Province[J]. Acta Prataculturae Sinica, 2012, 21(4): 293-299. ] | |
| [27] |
康立民, 滕心如, 车佳航, 等. 昆仑山北坡区域积雪时空变化特征[J]. 干旱区地理, 2024, 47(9): 1462-1471.
doi: 10.12118/j.issn.1000-6060.2024.115 |
|
[ Kang Limin, Teng Xinru, Che Jiahang, et al. Spatiotemporal variations of snow cover on the northern slope of Kunlun Mountains[J]. Arid Land Geography, 2024, 47(9): 1462-1471. ]
doi: 10.12118/j.issn.1000-6060.2024.115 |
|
| [28] | 刘勇, 张欣, 魏良帅, 等. 长江源气候变化及生态植被变迁分析[J]. 西北地质, 2025, 58(1): 257-269. |
| [ Liu Yong, Zhang Xin, Wei Liangshuai, et al. Analysis of climate change and vegetation change in the Yangtze River Source[J]. Northwestern Geology, 2025, 58(1): 257-269. ] | |
| [29] |
李若楠, 李均力, 李爽爽, 等. 基于Sentinel-2的依连哈比尔尕冰川变化监测[J]. 干旱区研究, 2024, 41(6): 940-950.
doi: 10.13866/j.azr.2024.06.04 |
|
[ Li Ruonan, Li Junli, Li Shuangshuang, et al. Monitoring the glacier changes in Yilian Habirga Mountain using Sentinel-2 data[J]. Arid Zone Research, 2024, 41(6): 940-950. ]
doi: 10.13866/j.azr.2024.06.04 |
|
| [30] | 车涛, 郝晓华, 戴礼云, 等. 青藏高原积雪变化及其影响[J]. 中国科学院院刊, 2019, 34(11): 1247-1253. |
| [ Che Tao, Hao Xiaohua, Dai Liyun, et al. Snow cover variation and its impacts over the Qinghai-Xizang Plateau[J]. Bulletin of Chinese Academy of Sciences, 2019, 34(11): 1247-1253. ] | |
| [31] | 史飞飞, 李晓东, 肖建设, 等. 基于MOD10A1 V6产品下青海省各片区积雪的分布气候特征[J]. 生态科学, 2024, 43(4): 27-38. |
| [ Shi Feifei, Li Xiaodong, Xiao Jianshe, et al. Climate characteristics of snow cover distribution in ecological function areas of Qinghai Province based on MOD10A1 V6[J]. Ecological Science, 2024, 43(4): 27-38. ] | |
| [32] | 苏家灿. 1986—2020年格拉丹东地区冰川变化遥感监测研究[D]. 昆明: 云南师范大学, 2023. |
| [ Su Jiacan. Study on Remote Sensing Monitoring of Glacier Changes in the Geladandong Region from 1986 to 2020[D]. Kunming: Yunnan Normal University, 2023. ] | |
| [33] | 周远刚, 赵锐锋, 张丽华, 等. 博格达峰地区冰川和积雪变化遥感监测及影响因素分析[J]. 干旱区地理, 2019, 42(6): 1395-1403. |
| [ Zhou Yuangang, Zhao Ruifeng, Zhang Lihua, et al. Remote sensing monitoring of the change of glacier and snow cover and its influencing factors in Mount Bogda[J]. Arid Land Geography, 2019, 42(6): 1395-1403. ] | |
| [34] | 除多, 拉巴卓玛, 拉巴, 等. 珠峰地区积雪变化与气候变化的关系[J]. 高原气象, 2011, 30(3): 576-582. |
| [ Chu Duo, Laba Zhuoma, La Ba, et al. Link between perennial snow cover variations and climate change in Qomolangma Nature Preserve from 1975 to 2000[J]. Plateau Meteorology, 2011, 30(3): 576-582. ] |
| [1] | 刘小明, 郑世妍, 乔占明. 基于PLUS-InVEST模型的三江源土地利用变化动态模拟与生境质量[J]. 干旱区研究, 2025, 42(6): 1080-1092. |
| [2] | 颜玉倩, 李甫, 陈奇, 杜华礼, 孙树娇. 青海三江源高寒荒漠与高寒草甸地表感热通量与潜热通量特征[J]. 干旱区研究, 2025, 42(3): 420-430. |
| [3] | 万佳怡, 矢佳昱, 张华敏, 李兰晖, 丁明军. 三江源区不同覆被类型高寒草甸土壤水分变化特征[J]. 干旱区研究, 2024, 41(8): 1343-1353. |
| [4] | 郭世钰, 张玉欣, 韩辉邦, 周万福, 康晓燕, 张莉燕. 三江源一次降水过程雨滴谱垂直演变特征[J]. 干旱区研究, 2024, 41(3): 353-362. |
| [5] | 王成武, 尧良杰, 汪宙峰, 张荞, 谢亮. 2000—2020年三江源地区景观生态风险评价及驱动因素[J]. 干旱区研究, 2024, 41(11): 1908-1920. |
| [6] | 黄小梅, 齐冬梅, 李笛, 孙亦, 吕纯月. 西亚副热带西风急流年际变化与三江源区夏季降水的关系[J]. 干旱区研究, 2023, 40(1): 1-8. |
| [7] | 韩辉邦,张玉欣,郭世钰,唐文婷. 三江源区积层混合云微物理特征机载观测试验研究[J]. 干旱区研究, 2022, 39(5): 1360-1370. |
| [8] | 王盼盼, 李忠勤, 王璞玉, 何海迪, 梁鹏斌, 牟建新. 北极山地冰川物质平衡变化及其对气候的响应[J]. 干旱区研究, 2020, 37(5): 1205-1214. |
| [9] | 许茜, 李奇, 陈懂懂, 罗彩云, 赵新全, 赵亮. 近40 a三江源地区土地利用变化动态分析及预测[J]. 干旱区研究, 2018, 35(3): 695-704. |
| [10] | 李开明, 陈世峰, 康玲芬, 李忠勤, 李生德, 文强. 中国大陆型冰川和海洋型冰川变化比较分析——以天山乌鲁木齐河源1号冰川和玉龙雪山白水河1号冰川为例[J]. 干旱区研究, 2018, 35(1): 12-19. |
| [11] | 徐春海, 王飞腾, 李忠勤, 王林, 王璞玉. 1972—2013年新疆玛纳斯河流域冰川变化[J]. 干旱区研究, 2016, 33(3): 628-635. |
| [12] | 李强. 近12 a三江源地区植被物候对水热的响应[J]. 干旱区研究, 2016, 33(1): 150-158. |
| [13] | 贾伟, 高小红, 杨扬, 张威, 杨灵玉, 田成明. 基于Landsat 8 OLI影像的三江源区表层土壤全氮空间格局反演[J]. 干旱区研究, 2015, 32(5): 890-896. |
| [14] | 王喆, 安如, 梁欣, 曲春梅, 姜丹萍. 基于TRMM的三江源区8月份干旱特征[J]. 干旱区研究, 2013, 30(4): 719-727. |
| [15] | 李珊珊, 张明军, 李忠勤, 李慧林, 骆书飞. 1960—2009年中国天山现代冰川末端变化特征[J]. 干旱区研究, 2013, 30(2): 378-384. |
|
||