Arid Zone Research ›› 2021, Vol. 38 ›› Issue (4): 919-929.doi: 10.13866/j.azr.2021.04.03
• Water Resources and Utilization • Previous Articles Next Articles
LI Jianjiang1( ),LI Jia1(),WU Lixin1,WANG Yingzheng1,2,GUO Lei1
Received:2020-11-02
Revised:2021-04-28
Online:2021-07-15
Published:2021-08-03
Contact:
Jia LI
E-mail:185012119@csu.edu.cn;lijia20050710@csu.edu.cn
LI Jianjiang,LI Jia,WU Lixin,WANG Yingzheng,GUO Lei. Simulating surface energy and mass balance of the Puruogangri ice cap during 2012-2014 based on High Asia Refined analysis data[J].Arid Zone Research, 2021, 38(4): 919-929.
Add to citation manager EndNote|Reference Manager|ProCite|BibTeX|RefWorks
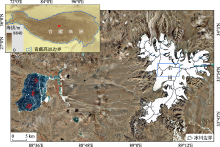
Fig. 1
Optical image of the Puruogangri ice cap"

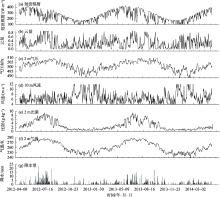
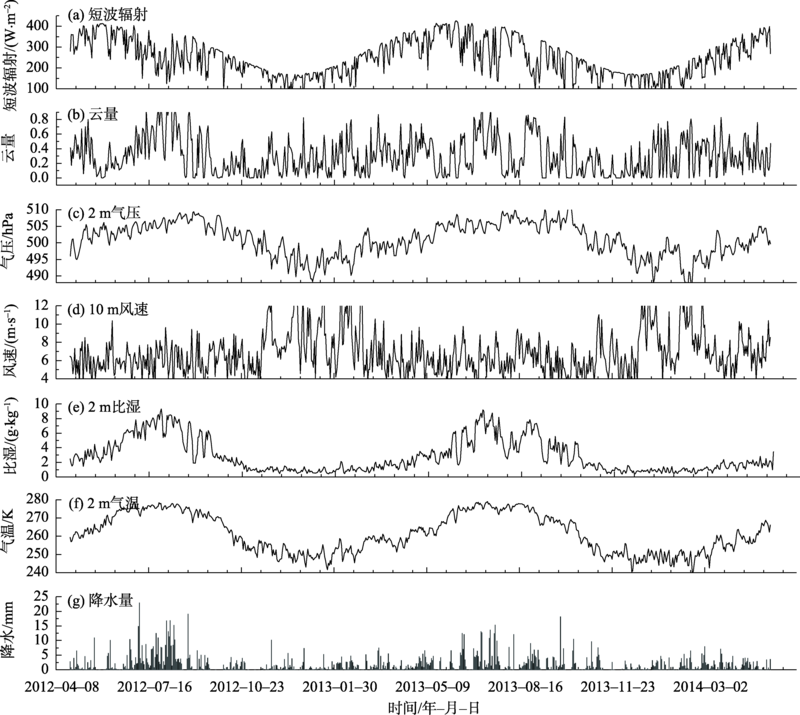
Fig. 2
Meteorological data for the highest elevation grid point (selected from DEMs with a resolution of 0.1° × 0.1°) corresponding to the period 23 April 2012 to 11 May 2014 for Puruogangri"
Tab. 1
Altitudinal gradients and correlation coefficients used to interpolate the grid HAR meteorological data"
| 梯度因子 | R2 | |
|---|---|---|
| 气温/(K·m-1) | -0.00830 | 0.98 |
| 气压/(hPa·m-1) | -0.06700 | 1.00 |
| 降水/(%·m-1) | 0.05300 | 0.67 |
| 比湿/(%·m-1) | -0.01050 | 0.96 |
| 10 m风速/(m·s-1·m-1) | 0.00170 | 0.13 |
| 云量 | 0.00001 | 0.09 |
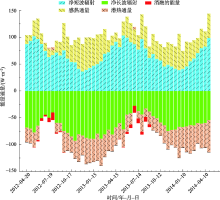
Fig. 3
Different components of the 15 days averaged energy fluxes at Puruogangri ice cap between April 23, 2012 and May 11, 2014"
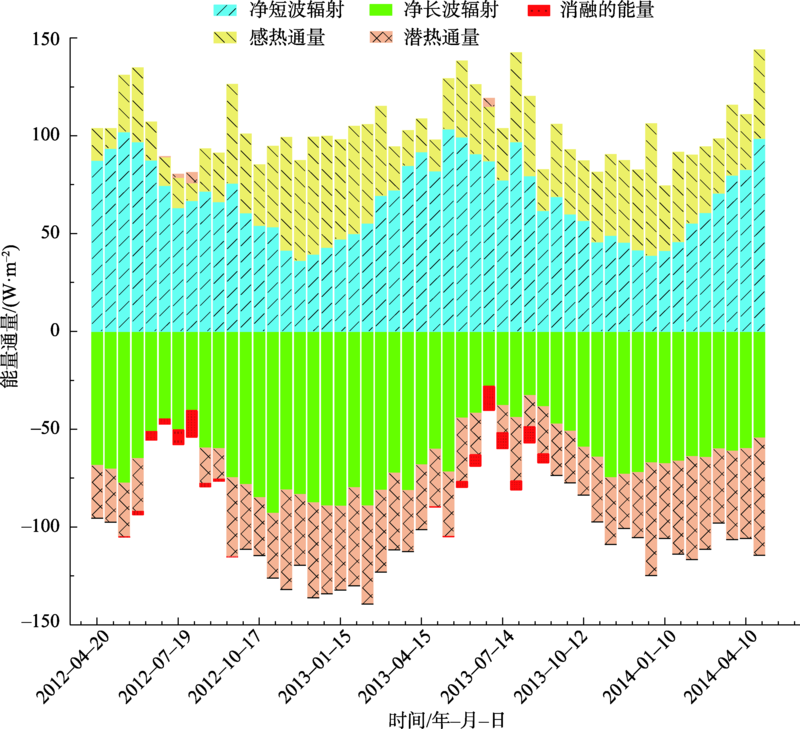
Tab. 2
Annual variation and contributions of different energy components at the puruogangri ice cap between April 23, 2012 and May 11, 2014"
| 能量绝对值总和 | 净短波辐射 | 净长波辐射 | 感热通量 | 潜热通量 | 地下传热 | 消融能量 | ||
|---|---|---|---|---|---|---|---|---|
| 2012-04-23— 2013-05-23 | 能量/(W·m-2) | 195.52 | 63.81 | -50.04 | 35.59 | -32.26 | -10.04 | -3.78 |
| 占比/% | - | 32.6 | 25.6 | 18.2 | 16.5 | 5.1 | 2.0 | |
| 2013-05-23— 2014-05-11 | 能量/(W·m-2) 占比/% | 203.07 | 67.09 | -53.82 | 36.54 | -33.34 | -10.31 | -1.97 |
| - | 33.0 | 26.5 | 18.0 | 16.4 | 5.0 | 1.1 |
Tab. 3
Different components of the simulated mass balance of puruogangri ice cap between April 23, 2012 and May 11, 2014"
| 物质平衡成分 | 2012-04-23— 2013-05-23 | 2013-05-23— 2014-05-11 |
|---|---|---|
| 表面消融/(m w.e.) | -0.67 | -0.56 |
| 冰下消融/(m w.e.) | -0.09 | -0.13 |
| 升华/(m w.e.) | -0.01 | -0.02 |
| 融水再冻结/(m w.e.) | +0.02 | +0.02 |
| 固态降水/(m w.e.) | +0.57 | +0.33 |
| 物质平衡/(m w.e.) | -0.18 | -0.36 |
Tab. 4
HAR meteorological data between April 23, 2012 and May 11, 2014"
| 参数 | 2012-04-23— 2013-05-23 | 2013-05-23—2014-05-11 |
|---|---|---|
| 向下短波辐射/(W·m-2) | 256.5 | 245.6 |
| 气温/K | 261.7 | 260.9 |
| 气压/hPa | 500.9 | 501.3 |
| 降水量/mm | 752.8 | 639.9 |
| 比湿/(g·kg-1) | 2.9 | 2.8 |
| 风速/(m·s-1) | 6.9 | 6.7 |
| 云量/% | 30.8 | 29.0 |
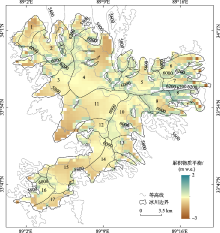
Fig. 4
Distribution of the mass balance of the Puruogangri ice cap between April 23, 2012 and May 11, 2014 simulated by COSIMA model (spatial resolution: 450 m×450 m)"

Tab. 5
Cumulative mass balance of 17 glaciers within the Puruogangri ice cap between April 23, 2012 and May 11, 2014"
| 冰川编号 | 1 | 2 | 3 | 4 | 5 | 6 | 7 | 8 | 9 | 10 | 11 | 12 | 13 | 14 | 15 | 16 | 17 |
|---|---|---|---|---|---|---|---|---|---|---|---|---|---|---|---|---|---|
| 物质平衡 /(m w.e.) | -0.87 | -0.37 | -0.59 | -058 | -0.30 | -0.43 | -0.18 | -0.02 | -0.27 | -0.44 | -0.76 | -0.45 | -0.48 | -0.71 | -0.67 | -0.48 | -0.73 |
| [1] | 赵景啟, 满苏尔·沙比提, 麦丽开·艾麦提, 等. 1992—2017年托木尔峰国家级自然保护区冰川变化[J]. 干旱区研究, 2020, 37(4):1079-1086. |
| [ Zhao Jingqi, Sabit Mansur, Aimaiti Mailikai, et al. Changing rates of glacier in Tomur National Nature Reserve from 1992 to 2017[J]. Arid Zone Research, 2020, 37(4):1079-1086. ] | |
| [2] | 高永鹏, 姚晓军, 安丽娜, 等. 2000—2010年祁连山冰川冰储量变化[J]. 干旱区研究, 2018, 35(2):325-333. |
| [ Gao Yongpeng, Yao Xiaojun, An Lina, et al. Change of ice volume in the Qilian Mountains during the period from 2000 to 2010[J]. Arid Zone Research, 2018, 35(2):328-333. ] | |
| [3] | 王盼盼, 李忠勤, 王璞玉, 等. 北极山地冰川物质平衡变化及其对气候的响应[J]. 干旱区研究, 2020, 37(5):113-122. |
| [ Wang Panpan, Li Zhongqin, Wang Puyu, et al. Changes in the mass balance of Arctic alpine glacier and its response to climate change[J]. Arid Zone Research, 2020, 37(5):113-122. ] | |
| [4] |
Kang S, Xu Y, You Q, et al. Review of climate and cryospheric change in the Tibetan Plateau[J]. Environmental Research Letters, 2010, 5:015101.
doi: 10.1088/1748-9326/5/1/015101 |
| [5] |
Yao T, Thompson L, Yang W, et al. Different glacier status with atmospheric circulations in Tibetan Plateau and surroundings[J]. Nature Climate Change, 2012, 2(9):663-667.
doi: 10.1038/nclimate1580 |
| [6] |
Bolch T, Yao T, Kang S, et al. A glacier inventory for the western Nyainqentanglha Range and the Nam Co Basin, Tibet, and glacier changes 1976-2009[J]. The Cryosphere, 2010, 4(3):419-433.
doi: 10.5194/tc-4-419-2010 |
| [7] |
Kääb A, Berthier E, Nuth C, et al. Contrasting patterns of early twenty-first-century glacier mass change in the Himalayas[J]. Nature, 2012, 488(7412):495-498.
doi: 10.1038/nature11324 |
| [8] | Neckel N, Kropáček J, Bolch T, et al. Glacier mass changes on the Tibetan Plateau 2003-2009 derived from ICESat laser altimetry measurements[J]. Environmental Research Letters, 2013, 9. 10.1088/1748-9326/9/1/014009. |
| [9] |
Neckel N, Braun A, Kropáček J, et al. Recent mass balance of the Purogangri Ice Cap, central Tibetan Plateau, by means of differential X-band SAR interferometry[J]. The Cryosphere, 2013, 7:1623-1633.
doi: 10.5194/tc-7-1623-2013 |
| [10] |
Liu L, Jiang L, Jiang H, et al. Accelerated glacier mass loss (2011-2016) over the Puruogangri ice field in the inner Tibetan Plateau revealed by bistatic InSAR measurements[J]. Remote Sensing of Environment, 2019, 231:111241.
doi: 10.1016/j.rse.2019.111241 |
| [11] |
Conway J P, Cullen N J. Cloud effects on surface energy and mass balance in the ablation area of Brewster Glacier, New Zealand[J]. The Cryosphere, 2016, 10(1):313-328.
doi: 10.5194/tc-10-313-2016 |
| [12] |
Hock R. Temperature index melt modelling in mountain areas[J]. Journal of Hydrology, 2003, 282(1):104-115.
doi: 10.1016/S0022-1694(03)00257-9 |
| [13] | Huintjes E, Li H, Sauter T, et al. Degree-day modelling of the surface mass balance of Urumqi Glacier No. 1, Tianshan, China[J]. The Cryosphere Discussions, 2010, 4:207-232. |
| [14] | Huintjes E, Sauter T, Schröter B, et al. Evaluation of a coupled snow and energy balance model for Zhadang Glacier, Tibetan Plateau, using glaciological measurements and time-lapse photography[J]. Arctic, Antarctic, and Alpine Research, 2015, 3. https://doi.org/10.1657/AAAR0014-073. |
| [15] |
Huintjes E, Neckel N, Hochschild V, et al. Surface energy and mass balance at Purogangri ice cap, central Tibetan Plateau, 2001-2011[J]. Journal of Glaciology, 2015, 61(230):1048-1060.
doi: 10.3189/2015JoG15J056 |
| [16] |
Lei Y, Yao T, Yi C, et al. Glacier mass loss induced the rapid growth of Linggo Co on the central Tibetan Plateau[J]. Journal of Glaciology, Cambridge University Press, 2012, 58(207):177-184.
doi: 10.3189/2012JoG11J025 |
| [17] |
Liu L, Jiang L, Sun Y, et al. Glacier elevation changes (2012-2016) of the Puruogangri Ice Field on the Tibetan Plateau derived from bi-temporal TanDEM-X InSAR data[J]. International Journal of Remote Sensing, 2016, 37(23-24):5687-5707.
doi: 10.1080/01431161.2016.1246777 |
| [18] |
Yi C, Li X, Qu J. Quaternary glaciation of Puruogangri-the largest modern ice field in Tibet[J]. Quaternary International, 2002, 97-98:111-121.
doi: 10.1016/S1040-6182(02)00056-3 |
| [19] | 蒲健辰, 姚檀栋, 王宁练, 等. 普若岗日冰原及其小冰期以来的冰川变化[J]. 冰川冻土, 2002, 24(1):87-92. |
| [ Pu Jianchen, Yao Tandong, Wang Ninglian, et al. Puruogangri ice field and its variations since the little ice age of the Northern Tibetan Plateau[J]. Journal of Glaciology and Geocryology, 2002, 24(1):87-92] | |
| [20] | 拉巴, 格桑卓玛, 拉巴卓玛, 等. 1992—2014年普若岗日冰川和流域湖泊面积变化及原因分析[J]. 干旱区地理, 2016, 39(4):770-776. |
| [ La Ba, Ge Sangzhuoma, La Bazhuoma, et al. Variation and reasons of the coverage of Puruogangri glacier and its surrounding lakes during 1992-2014[J]. Arid Land Geography, 2016, 39(4):770-776] | |
| [21] |
Thompson L G, Tandong Y, Davis M E, et al. Holocene climate variability archived in the Puruogangri ice cap on the central Tibetan Plateau[J]. Annals of Glaciology, 2006, 43:61-69.
doi: 10.3189/172756406781812357 |
| [22] |
Maussion F, Scherer D, Mölg T, et al. Precipitation seasonality and variability over the Tibetan Plateau as resolved by the high Asia reanalysis[J]. Journal of Climate, 2014, 27(5):1910-1927.
doi: 10.1175/JCLI-D-13-00282.1 |
| [23] |
Maussion F, Scherer D, Finkelnburg R, et al. WRF simulation of a precipitation event over the Tibetan Plateau, China: An assessment using remote sensing and ground observations[J]. Hydrology and Earth System Sciences, 2011, 15(6):1795-1817.
doi: 10.5194/hess-15-1795-2011 |
| [24] |
Kumar L, Skidmore A K, Knowles E. Modelling topographic variation in solar radiation in a GIS environment[J]. International Journal of Geographical Information Science, 1997, 11(5):475-497.
doi: 10.1080/136588197242266 |
| [25] |
Möller M, Schneider C, Kilian R. Glacier change and climate forcing in recent decades at Gran Campo Nevado, southernmost Patagonia[J]. Annals of Glaciology, 2007, 46:136-144.
doi: 10.3189/172756407782871530 |
| [26] | Allen R, Pereira L, Raes D, et al. Crop evapotranspiration: Guidelines for computing crop water requirements, FAO irrigation and drainage paper 56[J]. FAO, 1998, 56. |
| [27] | 刘健文. 天气分析预报物理量计算基础[M]. 北京: 气象出版社, 2005. |
| [ Liu Jianwen. Computational Basis of Physical Quantities Weather Analysis and Prediction[M]. Beijing: China Meteorological Press, 2005. ] | |
| [28] |
Braithwaite R J. Aerodynamic stability and turbulent sensible-heat flux over a melting ice surface, the Greenland ice sheet[J]. Journal of Glaciology, 1995, 41(139):562-571.
doi: 10.1017/S0022143000034882 |
| [29] | Anderson E A. A point Energy and Mass Balance Model of A Snow Cover[M]. Technical Report NWS19, NOAA, 1976. |
| [30] | Bintanja R, Broeke M R V D. The surface energy balance of Antarctic snow and blue ice[J]. Journal of Applied Meteorology and Climatology, 1995, 34(4):902-926. |
| [31] |
Oerlemans J, Knap W H. A 1 year record of global radiation and albedo in the ablation zone of Morteratschgletscher, Switzerland[J]. Journal of Glaciology, 1998, 44(147):231-238.
doi: 10.1017/S0022143000002574 |
| [32] |
Mölg T, Maussion F, Yang W, et al. The footprint of Asian monsoon dynamics in the mass and energy balance of a Tibetan glacier[J]. The Cryosphere, 2012, 6(6):1445-1461.
doi: 10.5194/tc-6-1445-2012 |
| [33] | 姚檀栋, 朴世龙, 沈妙根, 等. 印度季风与西风相互作用在现代青藏高原产生连锁式环境效应[J]. 中国科学院院刊, 2017, 32(9):976-984. |
| [ Yao Tandong, Piao Shilong, Shen Miaogen, et al. Chained impacts on modern environment of interaction between Westerlies and Indian Monsoon on Tibetan Plateau[J]. Bulletin of Chinese Academy of Sciences, 2017, 32(9):976-984. ] | |
| [34] |
Mölg T, Maussion F, Scherer D. Mid-latitude westerlies as a driver of glacier variability in monsoonal High Asia[J]. Nature Climate Change, 2014, 4(1):68-73.
doi: 10.1038/nclimate2055 |
| [1] | WANG Lihui,QIN Xiang,CHEN Jizu,ZHANG Dongwei,LIU Yushuo,LI Yanzhao,JIN Zizhen. Reconstruction of the glacier mass balance in the Qilian Mountains from 1961 to 2013 [J]. Arid Zone Research, 2021, 38(6): 1524-1533. |
| [2] | WANG Pan-pan, LI Zhong-qin, WANG Pu-yu, HE Hai-di, LIANG Peng-bin, MU Jian-xin. Changes in the mass balance of Arctic Alpine glacier and its response to climate change [J]. Arid Zone Research, 2020, 37(5): 1205-1214. |
| [3] | LI Kai-Ming, CHEN Shi-Feng, KANG Ling-Fen, LI Zhong-Qin, LI Sheng-De, WEN Qiang. Comparative research on Chinese continental glacier and temperate glacier changes:Taking Urumqi glacier No.1 and Baishui glacier No.1 as example [J]. , 2018, 35(01): 12-19. |
|
||