干旱区研究 ›› 2023, Vol. 40 ›› Issue (4): 647-654.doi: 10.13866/j.azr.2023.04.13
梁博明( ),刘新,郝媛媛(),楚彬,唐庄生
收稿日期:2022-07-31
修回日期:2023-03-02
出版日期:2023-04-15
发布日期:2023-04-28
通讯作者:
郝媛媛. E-mail: 作者简介:梁博明(2000-),男,主要从事草地生态研究. E-mail: 基金资助:
LIANG Boming(),LIU Xin,HAO Yuanyuan(),CHU Bin,TANG Zhuangsheng
Received:2022-07-31
Revised:2023-03-02
Online:2023-04-15
Published:2023-04-28
摘要:
荒漠区植被地上生物量是土地荒漠化监测和荒漠植被遥感信息提取的重要指标。本研究以甘肃民勤县为试验区,以哨兵2号(Sentinel-2)影像为数据源,构建了比值植被指数RVI、归一化植被指数NDVI、差值植被指数DVI、土壤调节植被指数SAVI及优化型土壤调节植被指数OSAVI 5种植被指数与植被实测地上生物量的估算模型(一元线性、指数、对数和二项式模型),并利用所选的最优模型,估算了研究区的地上生物量。结果表明: SAVI相较于RVI、NDVI、DVI和OSAVI指数同地上生物量之间的相关性最高(r=0.79),基于SAVI指数的二项式模型是研究区地上生物量估算的最优模型(R2=0.76),且精度较高(R2=0.73,RMSE=0.12)。民勤县的植被相对密集区主要分布于四大灌区(红崖山、环河、昌宁、南湖)、青土湖周边以及红沙岗镇西北区域,其他地域植被较为稀疏,无植被区[<0.005 kg·(100m2)-1]、低植被区[0.005~0.2 kg·(100m2)-1]、中植被区[0.2~0.5 kg·(100m2)-1]和高植被区[>0.5 kg·(100m2)-1]的占比分别为66%、21%、5%和8%。
梁博明, 刘新, 郝媛媛, 楚彬, 唐庄生. 基于5种植被指数的荒漠区植被生物量提取研究[J]. 干旱区研究, 2023, 40(4): 647-654.
LIANG Boming, LIU Xin, HAO Yuanyuan, CHU Bin, TANG Zhuangsheng. Extraction of desert vegetation information based on five vegetation indices[J]. Arid Zone Research, 2023, 40(4): 647-654.

图1
研究区地理位置及采样点分布"
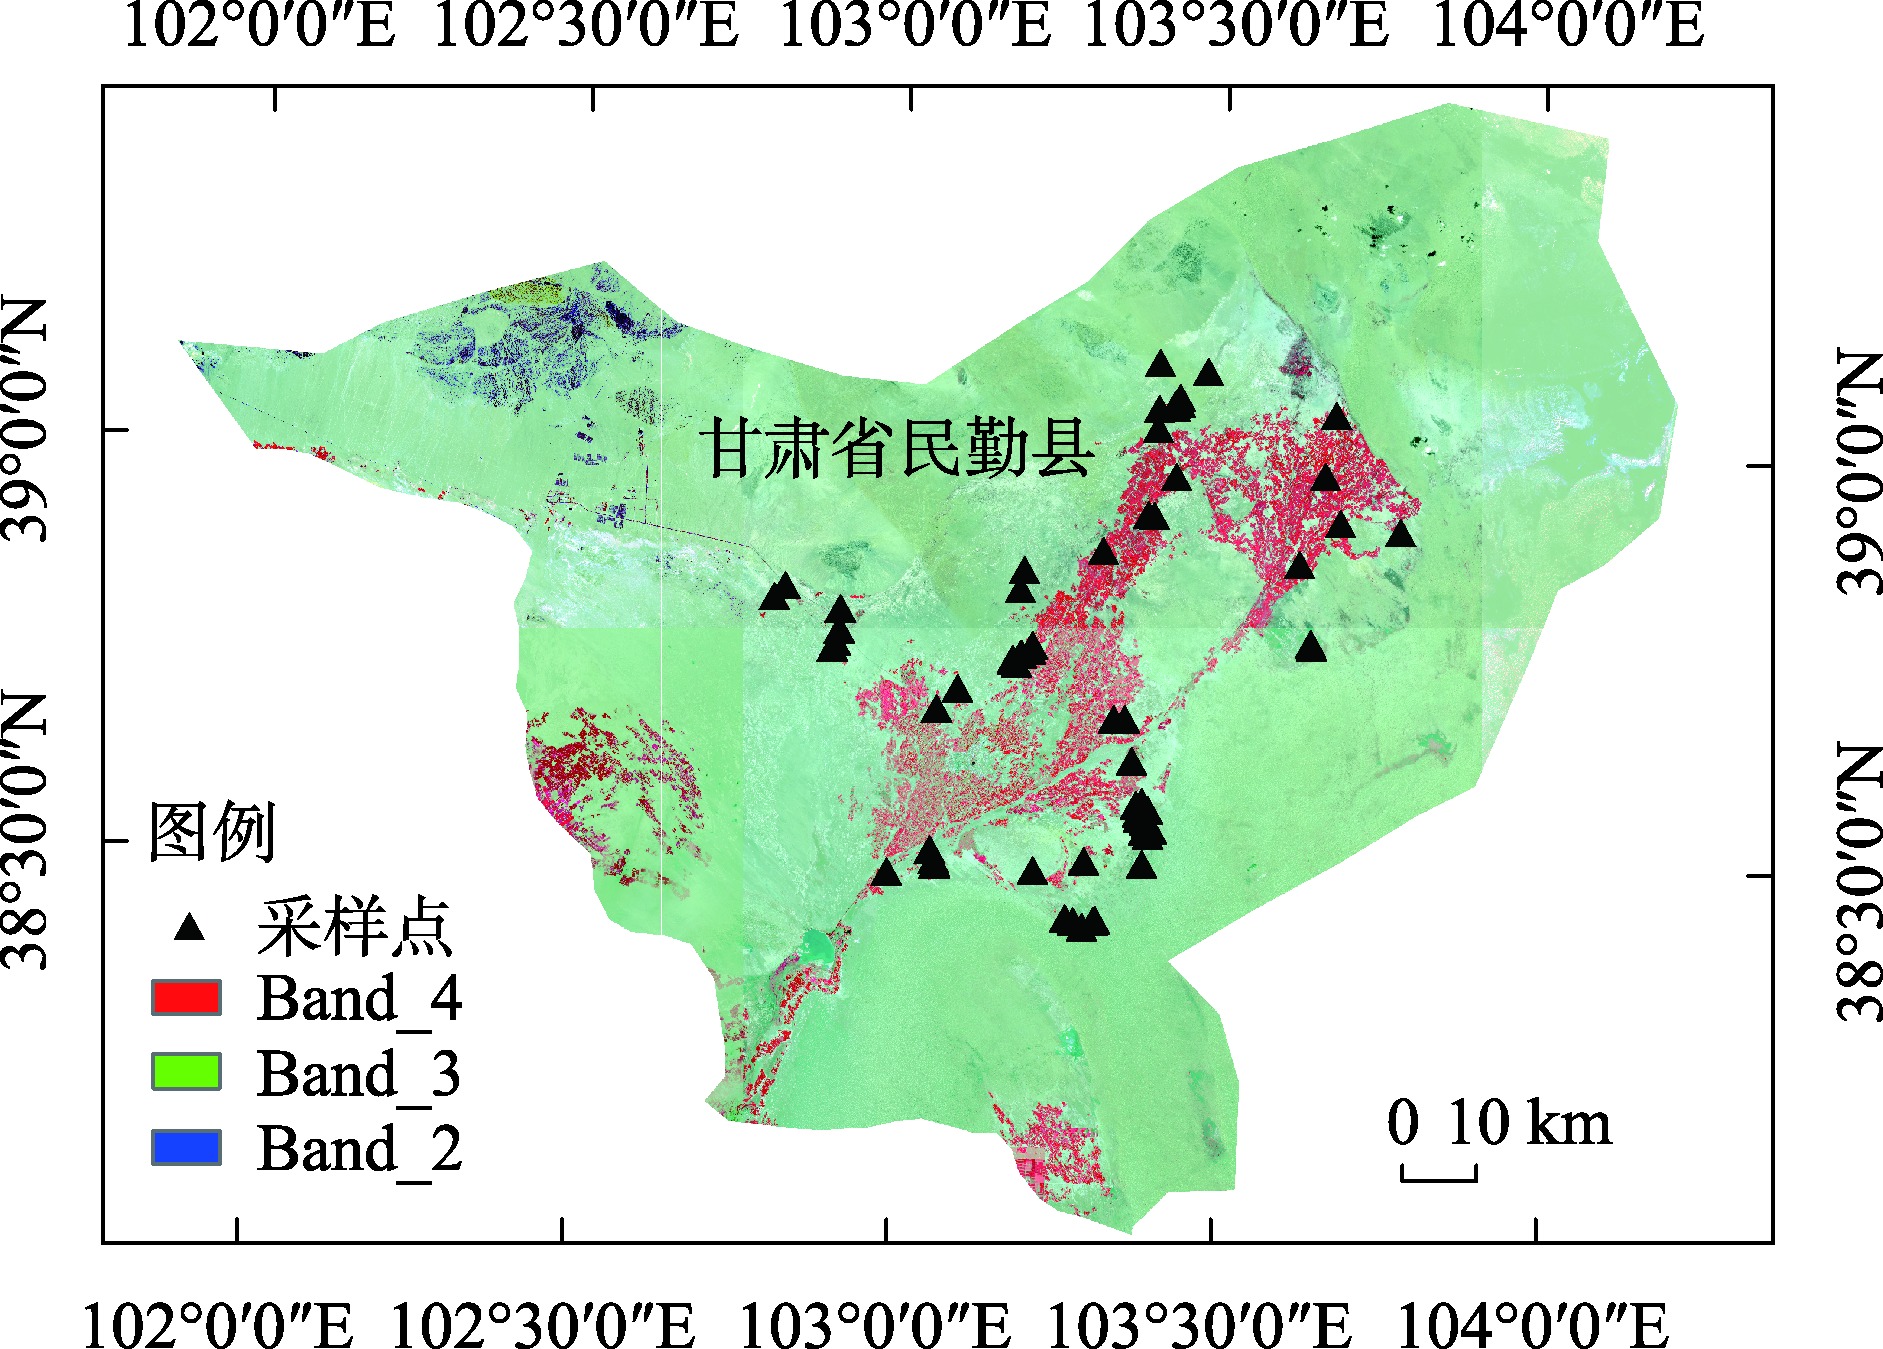
表1
样方内植物物种及其分类地位"
| 科 | 属 | 植物名称 |
|---|---|---|
| 豆科 Fabaceae | 苦参属Sophora | 苦豆子Sophora alopecuroides |
| 苦马豆属 Sphaerophysa | 苦马豆Sphaerophysa salsula | |
| 骆驼刺属 Alhagi | 骆驼刺Alhagi camelorum | |
| 锦鸡儿属 Caragana | 拧条锦鸡儿Caragana korshinskii | |
| 甘草属 Glycyrrhiza | 甘草Glycyrrhiza uralensis | |
| 菊科 Asteraceae | 花花柴属 Karelinia | 花花柴Karelinia caspia |
| 鸦葱属 Takhtajaniantha | 鸦葱Takhtajaniantha austriaca | |
| 漏芦属 Rhaponticum | 顶羽菊Rhaponticum repens | |
| 蓝刺头属 Echinops | 蓝刺头Echinops sphaerocephalus | |
| 旋覆花属 Inula | 蓼子朴Inula salsoloides | |
| 禾本科 Poaceae | 芦苇属 Phragmites | 芦苇Phragmites australis |
| 虎尾草属 Chloris | 虎尾草Chloris virgata | |
| 狗尾草属 Setaria | 狗尾草Setaria viridis | |
| 冰草属 Agropyron | 冰草Agropyron cristatum | |
| 苋科 Amaranthaceae | 梭梭属 Haloxylo | 梭梭Haloxylon ammodendron |
| 盐生草属 Halogeton | 蛛丝蓬Halogeton arachnoideus | |
| 盐爪爪属 Kalidium | 盐爪爪Kalidium foliatum | |
| 十字花科 Brassicaceae | 独行菜属 Lepidium | 宽叶独行菜Lepidium latifolium |
| 肉叶荠属Braya | 蚓果芥Braya humilis | |
| 藜科 Chenopodiaceae | 雾冰藜属 Bassia | 雾冰藜Bassia dasyphylla |
| 猪毛菜属 Salsola | 猪毛菜Salsola collinal | |
| 白刺科 Nitrariaceae | 骆驼蓬属 Peganum | 骆驼蓬Peganum harmala |
| 白刺属 Nitraria | 白刺Nitraria tangutorum | |
| 紫草科 Boraginaceae | 紫丹属 Tournefortia | 砂引草Tournefortia sibirica |
| 白花丹科 Plumbaginaceae | 补血草属 Limonium | 黄花补血草Limonium aureum |
| 石竹科 Caryophyllaceae | 石竹属 Dianthus | 石竹Dianthus chinensis |
| 旋花科 Convolvulaceae | 旋花属 Convolvulus | 田旋花Convolvulus arvensis |
| 夹竹桃科 Apocynaceae | 鹅绒藤属 Cynanchum | 戟叶鹅绒藤Cynanchum acutum |
| 柽柳科 Tamaricaceae | 柽柳属 Tamarix | 柽柳Tamarix chinensis |
| 胡颓子科 Elaeagnaceae | 胡颓子属 Elaeagnus | 沙枣Elaeagnus angustifolia |
| 毛茛科 Ranunculaceae | 铁线莲属 Clematis | 黄花铁线莲Clematis intricata |
| 麻黄科 Ephedraceae | 麻黄属 Ephedra | 草麻黄Ephedra sinica |
| 茄科 Solanaceae | 枸杞属 Lycium | 枸杞Lycium chinense |
表2
哨兵2号数据波段特征"
| 波段号 | 哨兵2号波段 | 中心波长/nm | 空间分辨率/m |
|---|---|---|---|
| 1 | Coastal aerosol | 433 | 60 |
| 2 | Blue | 490 | 10 |
| 3 | Green | 560 | 10 |
| 4 | Red | 665 | 10 |
| 5 | Vegetation Red Edge | 705 | 20 |
| 6 | Vegetation Red Edge | 740 | 20 |
| 7 | Vegetation Red Edge | 783 | 20 |
| 8 | NIR | 842 | 10 |
| 8A | Vegetation Red Edge | 865 | 20 |
| 9 | Water vapour | 945 | 60 |
| 10 | SWIR-Cirrus | 1375 | 60 |
| 11 | SWIR | 1610 | 20 |
| 12 | SWIR | 2190 | 20 |
表3
研究区遥感影像数据列表"
| 影像编号 | 成像日期 | 处理基线编号 | 相对轨道编号 | 拼接地域编号 |
|---|---|---|---|---|
| 1 | 2020-07-26 | N0214 | R004 | T48SUJ |
| 2 | 2020-07-26 | N0214 | R004 | T48SVH |
| 3 | 2020-07-26 | N0214 | R004 | T48STJ |
| 4 | 2020-07-26 | N0214 | R004 | T48SUH |
| 5 | 2020-08-05 | N0214 | R004 | T48STH |
| 6 | 2020-08-25 | N0214 | R004 | T48SVJ |
表4
植被指数及其计算公式"
| 植被指数 | 计算公式 |
|---|---|
| 比值植被指数RVI | RVI=NIR/RED |
| 归一化植被指数NDVI | NDVI=(NIR-RED)/(NIR+RED) |
| 差值植被指数DVI | DVI=NIR-RED |
| 土壤调节植被指数SAVI | SAVI=(1+L)(NIR-RED)/(NIR+RED+L) |
| 优化型土壤调节植被指数OSAVI | OSAVI=(NIR-RED)/(NIR+RED+X) |
表5
研究区植被地上生物量划分标准"
| 植被划分 | 植被地上生物量 /[kg·(100m2)-1] | 覆被特征 |
|---|---|---|
| 无植被区 | <0.005 | 沙地、盐碱地和裸土地等 |
| 低植被区 | 0.005~0.2 | 低产草地、撂荒地、疏林地以及中度沙化、盐渍化土地等 |
| 中植被区 | 0.2~0.5 | 中产草地、低郁闭林地、灌木林地以及轻度沙化、盐渍化土地等 |
| 高植被区 | >0.5 | 高产草地、耕地和密林等 |
表6
5种植被指数与地上生物量的相关性"
| 相关系数 | RVI | NDVI | DVI | SAVI | OSAVI |
|---|---|---|---|---|---|
| r | 0.70* | 0.68* | 0.67* | 0.79* | 0.67* |
表7
基于遥感影像植被指数的地上生物量估算模型"
| 植被指数 | 估算模型 | R2 |
|---|---|---|
| RVI | y = 0.8487x - 0.0043 | 0.59 |
| y = 0.226ln(x) + 0.558 | 0.44 | |
| y = 0.05e3.5318x | 0.49 | |
| y = 0.3182x2 + 0.5621x + 0.0385 | 0.60 | |
| NDVI | y = 0.57x + 0.0196 | 0.46 |
| y = 0.0475ln(x) + 0.2385 | 0.15 | |
| y= 0.0655e2.2292x | 0.60 | |
| y = 1.2093x2 - 0.2675x + 0.0998 | 0.63 | |
| DVI | y = 2691.5x + 166.29 | 0.44 |
| y = 219.99ln(x) + 1190.7 | 0.14 | |
| y = 380.99e1.9669x | 0.57 | |
| y = 5736.5x2 - 1280.9x + 546.96 | 0.62 | |
| SAVI | y = 0.8396x + 0.0364 | 0.62 |
| y = 0.0707ln(x) + 0.3604 | 0.21 | |
| y = 0.101e2.3966x | 0.73 | |
| y = 1.3554x2 - 0.099x + 0.1263 | 0.76 | |
| OSAVI | y = 0.689x + 0.017 | 0.45 |
| y = 0.0578ln(x) + 0.2823 | 0.15 | |
| y = 0.0707e2.3733x | 0.59 | |
| y = 1.412x2 - 0.2888x + 0.1107 | 0.61 |
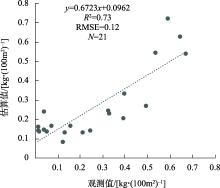
图2
地上生物量估算值与观测值拟合结果"
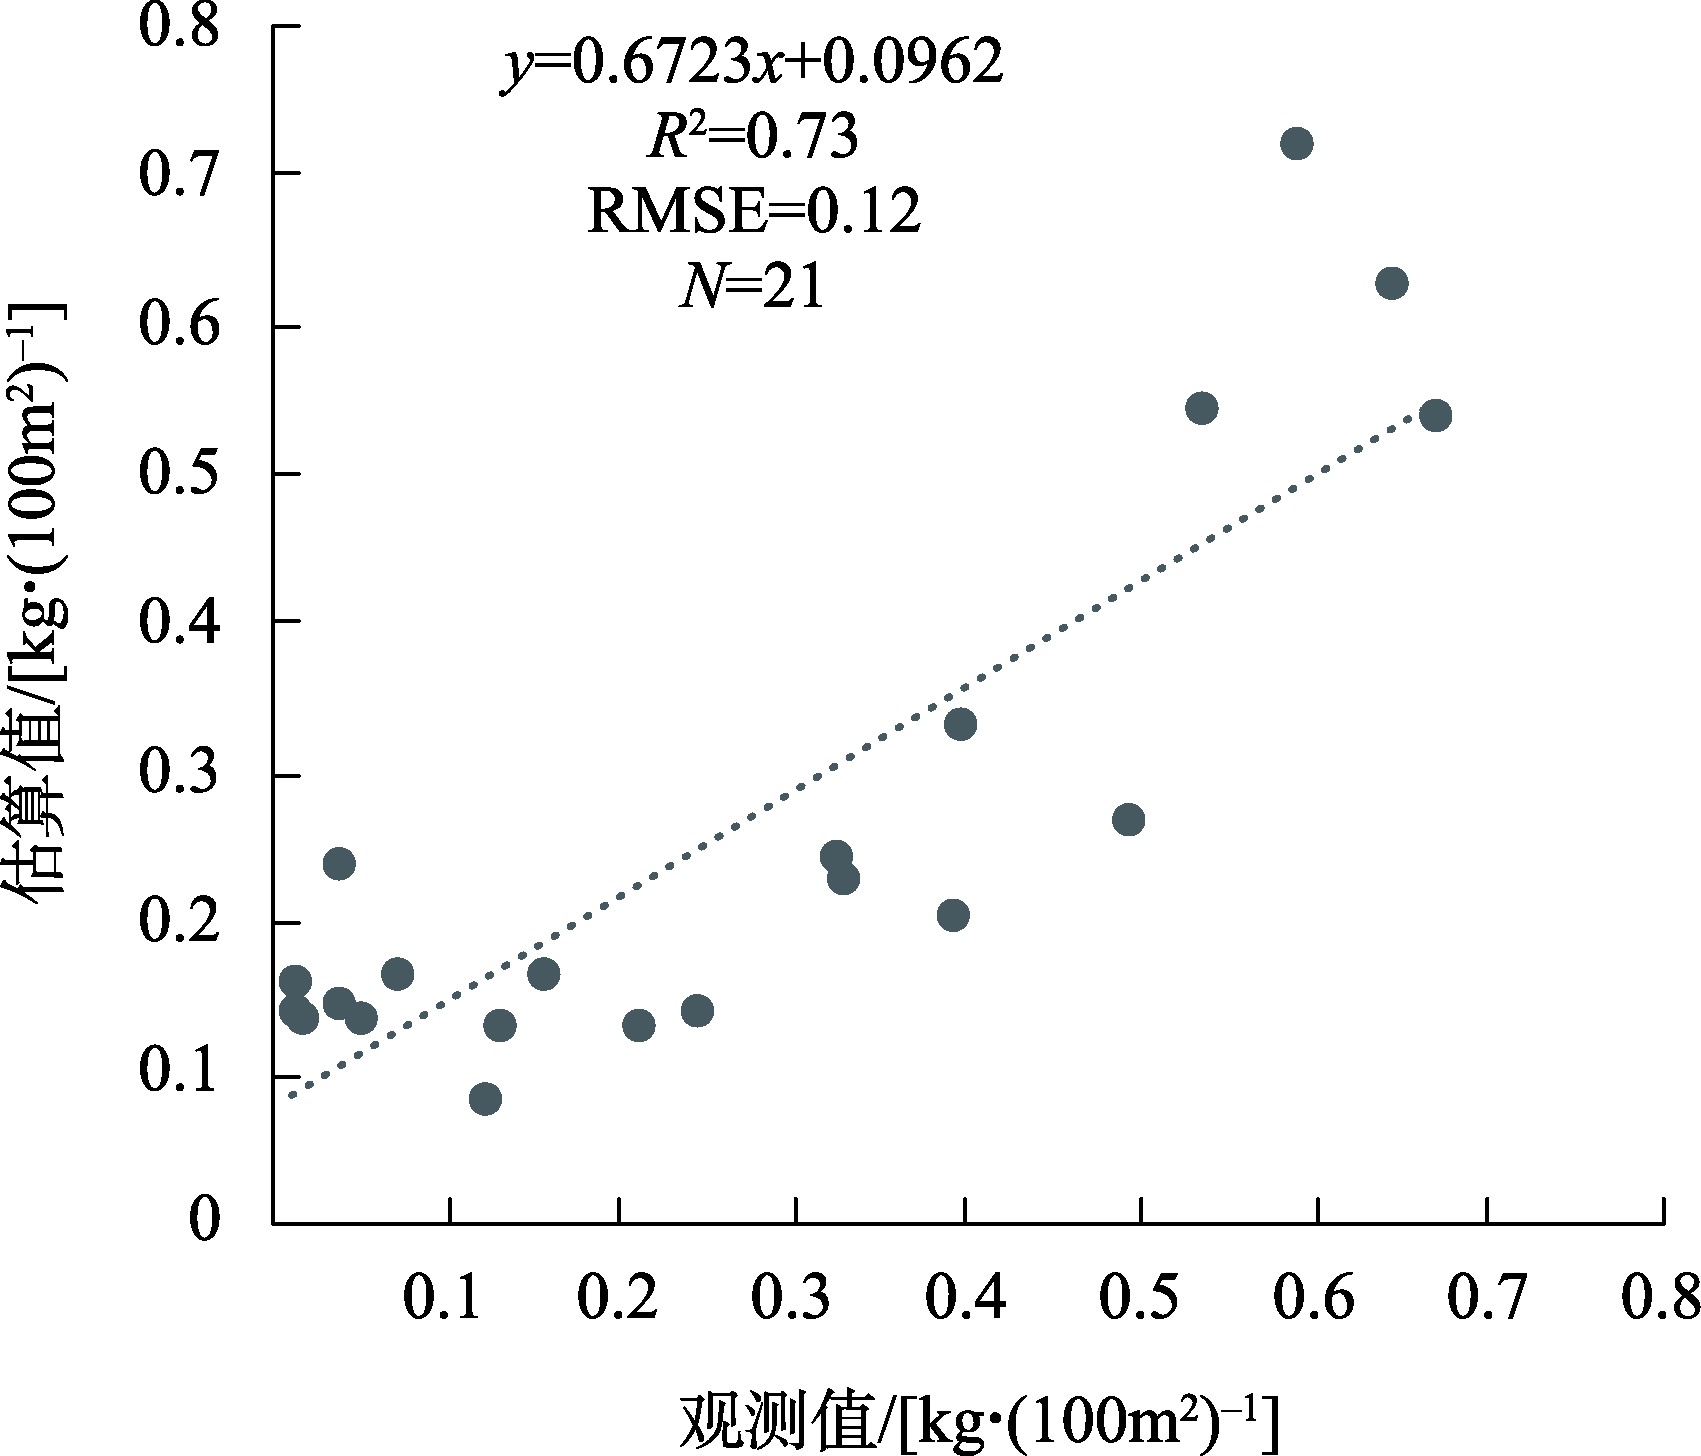
图3
基于SAVI二项式模型的研究区地上生物量空间分布"

| [1] | 匡志盈. 全球防治荒漠化情况综述[J]. 世界农业, 2006(10): 8-10. |
| [Kuang Zhiyin. Review of global desertification control[J]. World Agriculture, 2006(10): 8-10.] | |
| [2] | 滕玲. 第五次全国荒漠化和沙化土地监测结果发布——十年治沙:剩下的都是“硬骨头”[J]. 地球, 2016, 238(2): 50-53. |
| [Teng Ling. Fifth National Desertification and Desertification Land Monitoring Results Released-Ten Years of Desertification Control: The Remaining are ‘Hard Bones’[J]. Earth, 2016, 238(2): 50-53.] | |
| [3] | 杨俊杰. 荒漠化灾害经济损失及防沙治沙工程效益评估[D]. 北京: 北京林业大学, 2006. |
| [Yang Junjie. Desertification Calamity Economic Evaluation and Desertification Combating Engineering Profit Evaluation[D]. Beijing: Beijing Forestry University, 2006.] | |
| [4] | 杨俊杰, 张克斌, 乔锋, 等. 荒漠化灾害经济损失研究进展[J]. 水土保持研究, 2006, 13(4): 40-43. |
| [Yang Junjie, Zhang Kebin, Qiao Feng, et al. The research course in study of economic loss of desertification[J]. Research of Soil and Water Conservation, 2006, 13(4): 40-43.] | |
| [5] | 杨福芹, 冯海宽, 刘小强, 等. 马铃薯地上部干生物量光谱指数的建立及模型构建[J]. 东北农业科学, 2022, 47(5): 107-110. |
| [Yang Fuqin, Feng Haikuan, Liu Xiaoqiang, et al. Establishment and model construction based on spectral Index of aboveg-round dry biomass of potato[J]. Journal of Northeast Agricultural Sciences, 2022, 47(5): 107-110.] | |
| [6] | 康耀江. 植被指数在草地遥感中的应用初探[J]. 湖南农业科学, 2011, 261(Z1): 39-41. |
| [Kang Yaojiang. Application of vegetation index in grassland remote sensing[J]. Hunan Agricultural Sciences, 2011, 261(Z1): 39-41.] | |
| [7] | 叶静芸, 吴波, 刘明虎, 等. 乌兰布和沙漠东北缘荒漠-绿洲过渡带植被地上生物量估算[J]. 生态学报, 2018, 38(4): 1216-1225. |
| [Ye Jingyun, Wu Bo, Liu Minghu, et al. Estimation of aboveground biomass of vegetation in the desert-oasis transitional zone on the northeastern margin of the Ulan Buh Desert[J]. Acta Ecologica Sinica, 2018, 38(4): 1216-1225.] | |
| [8] | 陈琪, 赵健, 杨九艳, 等. 荒漠草场地上生物量的遥感监测——以内蒙古阿拉善盟为例[J]. 中国草地学报, 2020, 42(2): 105-116. |
| [Chen Qi, Zhao Jian, Yang Jiuyan, et al. Remote sensing monitoring of biomass on desert grassland: a case study of Alxa League in Inner Mongolia[J]. Chinese Journal of Grassland, 2020, 42(2): 105-116.] | |
| [9] |
Wu Junjun, Gao Zhihai, Li Zengyuan, et al. Estimation for sparse vegetation information in desertification region based on Tiangong-1 hyperspectral image[J]. Spectroscopy and Spectral Analysis, 2014, 34(3): 751-756.
pmid: 25208406 |
| [10] | 杨丽萍, 白宇兴, 朱江山, 等. 基于优选植被指数和TVDI的额济纳绿洲旱情监测[J]. 兰州大学学报(自然科学版), 2021, 57(6): 727-734. |
| [Yang Liping, Bai Yuxing, Zhu Jiangshan, et al. Drought monitoring in Ejina Oasis based on optimal vegetation index and TVDI[J]. Journal of Lanzhou University(Natural Sciences), 2021, 57(6): 727-734.] | |
| [11] | 张锦丽. 准噶尔盆地荒漠草地植被生物量遥感反演研究[D]. 乌鲁木齐: 新疆农业大学, 2020. |
| [Zhang Jinli. Study on Biomass Inversion of Desert Grassland in Junggar Basin[D]. Urumqi: Xinjiang Agricultural University, 2020.] | |
| [12] | 曹文梅, 刘廷玺, 王喜喜, 等. 科尔沁沙丘草甸相间地区土地利用与覆被识别[J]. 干旱区研究, 2021, 38(2): 526-535. |
| [Cao Wenmei, Liu Tingxi, Wang Xixi, et al. Land use and land cover classifications of Horqin Sandy Land dune-meadow areas[J]. Arid Zone Research, 2021, 38(2): 526-535.] | |
| [13] | 郑朝菊. 基于激光雷达和外推模型的森林地上生物量估算研究[D]. 北京: 中国科学院遥感与数字地球研究所, 2017. |
| [Zheng Zhaoju. Forest Aboveground Biomass Estimation Using LiDAR and Scaling Model in the Three Gorges Region of China[D]. Beijing: Institute of Remote Sensing and Digital Earth, 2017.] | |
| [14] | 徐高兴, 赵鹏, 陈思航, 等. 民勤绿洲荒漠过渡带沙拐枣群落种间关联及生态位研究[J]. 西北林学院学报, 2023, 38(1): 25-33. |
| [Xu Gaoxing, Zhao Peng, Chen Sihang, et al. Interspecific association and niche of Calligonum mongolicum community in Minqin oasis-desert transition zone[J]. Journal of Northwest Forestry University, 2023, 38(1): 25-33.] | |
| [15] | 赵鹏, 朱淑娟, 段晓峰, 等. 民勤绿洲边缘阻沙带表层土壤粒度空间分布特征[J]. 干旱区研究, 2021, 38(5): 1335-1345. |
| [Zhao Peng, Zhu Shujuan, Duan Xiaofeng, et al. Spatial distribution characteristics of grain size of surface soil in the sand-resitant belt of Minqin Oasis marginal[J]. Arid Zone Research, 2021, 38(5): 1335-1345.] | |
| [16] |
李耀辉, 沈洁, 赵建华, 等. 地形对民勤沙尘暴发生发展影响的模拟研究——以一次特强沙尘暴为例[J]. 中国沙漠, 2014, 34(3): 849-860.
doi: 10.7522/j.issn.1000-694X.2013.00385 |
|
[Li Yaohui, Shen Jie, Zhao Jianhua, et al. Simulation of terrain effect to the development of sandstorm in Minqin-Take a heavy sandstorm for example[J]. Journal of Desert Research, 2014, 34(3): 849-860.]
doi: 10.7522/j.issn.1000-694X.2013.00385 |
|
| [17] | 陈荷生. 甘肃民勤盆地水资源条件变化对环境的影响[J]. 自然资源, 1984(3): 62-71. |
| [Chen Hesheng. The influence of water resources condition change on environment in Minqin Basin Gansu Province[J]. Resources Science, 1984(3): 62-71.] | |
| [18] | 张书涵. 浅析甘肃民勤生态问题[J]. 知识文库, 2018, 426(3): 200. |
| [Zhang Shuhan. Analysis of ecological problems in Gansu Minqin[J]. Knowledge Library, 2018, 426(3): 200.] | |
| [19] | 孙涛, 贾志清, 钱雅玲, 等. 民勤荒漠—绿洲过渡带不同发育阶段白刺灌丛沙堆的防风固沙功能分析[J]. 云南农业大学学报(自然科学), 2019, 34(4): 713-724. |
| [Sun Tao, Jia Zhiqing, Qian Yaling, et al. Comparison on functions of wind-break and sand-fixation of Nitraria tangutorun Nebkhas at different developmental stages in Minqin desert-oasis transition zone[J]. Journal of Yunnan Agricultural University(Natural Science), 2019, 34(4): 713-724.] | |
| [20] | 曹永香, 毛东雷, 薛杰, 等. 绿洲-沙漠过渡带植被覆盖动态变化及其驱动因素——以新疆策勒为例[J]. 干旱区研究, 2022, 39(2): 510-521. |
| [Cao Yongxiang, Mao Donglei, Xue Jie, et al. Dynamic changes and driving factors of vegetation cover in the oasis-desert ecotone: A case study of Cele, Xinjiang[J]. Arid Zone Research, 2022, 39(2): 510-521.] | |
| [21] | 徐高兴, 赵鹏, 刘光武, 等. 民勤绿洲边缘荒漠植物群落特征研究[J]. 内蒙古林业科技, 2022, 48(1): 14-18. |
| [Xu Gaoxing, Zhao peng, Liu Guangwu, et al. Characteristics of desert vegetation community on the edge of Minqin oasis[J]. Inner Mongolia Forestry Science and Technology, 2022, 48(1): 14-18.] | |
| [22] | 赵多明, 张杰, 胡生新, 等. 甘肃民勤连古城国家级自然保护区药用植物资源多样性及珍稀濒危和优势药用植物资源调查[J]. 甘肃科技, 2016, 32(24): 125-131. |
| [Zhao Duoming, Zhang Jie, Hu Shengxin, et al. Investigation of medicinal plant resources diversity and rare, endangered and dominant medicinal plant resources in Gansu Minqin Liangucheng National Nature Reserve[J]. Gansu Science and Technology, 2016, 32(24): 125-131.] | |
| [23] | 蔡兆炜, 孙玉军, 刘凤娇. 长白落叶松林下灌木生物量模型研究[J]. 河南农业科学, 2013, 42(6): 126-129. |
| [Cai Zhaowei, Sun Yujun, Liu Fengjiao. Studies on biomass model of understory shrubs in Larix olgensis Herry. plantation[J]. Journal of Henan Agricultural Sciences, 2013, 42(6): 126-129.] | |
| [24] |
Colombo R, Bellingeri D, Fasolini D, et al. Retrieval of leaf area index in different vegetation types using high resolution satellite data[J]. Remote Sensing of Environment, 2003, 86(1): 120-131.
doi: 10.1016/S0034-4257(03)00094-4 |
| [25] | 王维, 王文杰, 李俊生, 等. 基于归一化差值植被指数的极端干旱气象对西南地区生态系统影响遥感分析[J]. 环境科学研究, 2010, 23(12): 1447-1455. |
| [Wang Wei, Wang Wenjie, Li Junsheng, et al. Remote sensing analysis of impacts of extreme drought weather on ecosystems in southwest region of China based on normalized difference vegetation index[J]. Research of Environmental Science, 2010, 23(12): 1447-1455.] | |
| [26] |
Huete A R. A soil-adjusted vegetation index (SAVI)[J]. Remote Sensing of Environment, 1988, 25(3): 295-309.
doi: 10.1016/0034-4257(88)90106-X |
| [27] | 段敏杰. 放牧干扰下藏北紫花针茅高寒草地生物量遥感监测[D]. 北京: 中国农业科学院, 2011. |
| [Duan Minjie. Remote Sensing Monitoring of Stipa purpurea Alpine Grassland Aboveground Biomass Under Grazing Disturbance in Northern Tibet[D]. Beijing: Chinese Academy of Agricultural Sciences, 2011.] | |
| [28] | 李响, 刘明, 刘明辉, 等. 基于样本个体差异性的深度神经网络训练方法[J]. 软件学报, 2022, 33(12): 4534-4544. |
| [Li Xiang, Liu Ming, Liu Minghui, et al. Deep neural network training method based on individual differences of samples[J]. Journal of Software, 2022, 33(12): 4534-4544.] | |
| [29] | 王佳, 马睿, 马德新. 基于深度学习的登海605玉米品种真伪鉴别方法研究[J/OL]. 中国粮油学报, 2023, 1-12. |
| [Wang Jia, Ma Rui, Ma Dexin. Identification method of Denghai 605 Maize varieties based on deep learning[J/OL]. Chinese Journal of Grain and Oil, 2023, 1-12.] | |
| [30] |
褚璇, 王伟, 赵昕, 等. 近红外光谱和特征光谱的山茶油掺假鉴别方法研究[J]. 光谱学与光谱分析, 2017, 37(1): 75-79.
pmid: 30192483 |
|
[Chu Xuan, Wang Wei, Zhao Xin, et al. Detection of Camellia oleifera oil adulterated with sunflower oil with near infrared (NIR) spectroscopy and characteristic spectra[J]. Spectroscopy and spectral analysis, 2017, 37(1): 75-79.]
pmid: 30192483 |
|
| [31] |
王晓珂, 刘婷婷, 许桂玲, 等. 基于冠层高光谱遥感的杂交水稻植被指数氮素营养诊断模型[J]. 中国稻米, 2021, 27(3): 21-29.
doi: 10.3969/j.issn.1006-8082.2021.03.005 |
|
[Wang Xiaoke, Liu Tingting, Xu Guiling, et al. Nitrogen diagnosis model of vegetation indices based on canopy hyperspectral remote sensing for hybrid rice[J]. Chinese Rice, 2021, 27(3): 21-29.]
doi: 10.3969/j.issn.1006-8082.2021.03.005 |
|
| [32] | 刘晓春. 民勤荒漠草地植物群落及其优势种群结构与动态研究[D]. 兰州: 甘肃农业大学, 2008. |
| [Liu Xiaochun. The Structure and Dynamics of Plant Communities and the Dominant Population in Minqin Desert Grassland[D]. Lanzhou: Gansu Agricultural University, 2008.] | |
| [33] | 陶冶. 准噶尔荒漠典型植物群落生物量的分配,估测与空间分布[D]. 北京: 中国科学院大学, 2014. |
| [Tao Ye. Biomass Allocation, Estimation and Spatial Distribution of Typical Plant Communities in Junggar Desert[D]. Beijing: University of Chinese Academy of Sciences, 2014.] | |
| [34] | 赵鹏. 民勤绿洲荒漠过渡带植被空间分布及其环境解释[D]. 兰州: 甘肃农业大学, 2014. |
| [Zhao Peng. Spatial Distribution of Plant Communities and Environmental Interpretation in Minqin Oasis-Desert Ecotone[D]. Lanzhou: Gansu Agricultural University, 2014.] | |
| [35] |
贾宝全, 慈龙骏, 蔡体久, 等. 绿洲-荒漠交错带环境特征初步研究[J]. 应用生态学报, 2002, 13(9): 1104-1108.
pmid: 12561171 |
|
[Jia Baoquan, Ci Longjun, Cai Tijiu, et al. Preliminary research on environmental characteristics of oasis-desert ecotone[J]. Chinese Journal of Applied Ecology, 2002, 13(9): 1104-1108.]
pmid: 12561171 |
|
| [36] | 马浩, 孟德利, 赵勇, 等. 民勤绿洲植被变化与水资源结构响应关系[J]. 南水北调与水利科技, 2022, 20(5): 902-913. |
| [Ma Hao, Meng Deli, Zhao Yong, et al. Relationship between vegetation change and water resources structure in Minqin oasis[J]. South-to-North Water Transfers and Water Science & Technology, 2022, 20(5): 902-913.] | |
| [37] | 郝媛媛. 基于GIS/RS的西北内陆河流域生态恢复效果评价研究——以石羊河下游民勤盆地为例[D]. 兰州: 兰州大学, 2017. |
| [HAO Yuanyuan. Evaluation of Ecological Restoration Effects Based on GIS/RS for Northwest Inland River Basin, China: A Case Study of Minqin Basin in the Downstream of Shiyang River[D]. Lanzhou: Lanzhou University, 2017.] | |
| [38] | 高宇婷, 于洋, 孙凌霄, 等. 塔里木盆地南缘绿洲土地覆盖变化及驱动力[J]. 干旱区研究, 2021, 38(4): 1172-1183. |
| [Gao Yuting, Yu Yang, Sun Lingxiao, et al. Land coverage change and driving force of an oasis in the southern margin of Tarim Basin[J]. Arid Zone Research, 2021, 38(4): 1172-1183.] | |
| [39] | 李恩菊. 巴丹吉林沙漠与腾格里沙漠沉积物特征的对比研究[D]. 西安: 陕西师范大学, 2011. |
| [Li Enju. Comparative Study on Sediment Characteristics of Badain Jaran Desert and Tengger Desert[D]. Xi’an: Shaanxi Normal University, 2011.] | |
| [40] | 李伟娜. 多角度高光谱CHRIS数据估测隆宝滩湿地植被生物量的研究[D]. 北京: 中国林业科学研究院, 2017. |
| [Li Weina. Study on Diomass Estimation of Wetland Vegetation in Longbaotan Area based on Multi-angle and Hyperspectral CHRIS Data[D]. Beijing: Chinese Academy of Forestry, 2017.] | |
| [41] | 马中刚. 康保县荒漠化地区植被覆盖度遥感反演研究[D]. 长沙: 中南林业科技大学, 2016. |
| [Ma Zhonggang. Quantitative Retrieval of Vegetation Cover for Kangbao County-A Desert Area based on Remote Sensing[D]. Changsha: Central South University of Forestry and Technology, 2016.] | |
| [42] | 张锦丽, 张丽, 张鲜花, 等. 准噶尔盆地荒漠灌丛植被地上生物量反演研究[J]. 新疆农业大学学报, 2019, 42(3): 202-209. |
| [Zhang Jinli, Zhang Li, Zhang Xianhua, et al. Inversion of aboveground biomass of desert shrub vegetation in Junggar Basin[J]. Journal of Xinjiang Agricultural University, 2019, 42(3): 202-209.] | |
| [43] | Huete A R, Liu H, De Lira G R, et al. A soil color index to adjust for soil and litter noise in vegetation index imagery of arid regions[C]// Proceedings of IGARSS'94-1994 IEEE International Geoscience and Remote Sensing Symposium. IEEE, 1994: 1042-1043. |
| [1] | 孙丹阳,魏建新,杨辽,王杰,唐宇琪,巴比尔江·迪力夏提. 深度学习方法下GEDI数据的天然云杉林地上生物量反演[J]. 干旱区研究, 2023, 40(9): 1472-1483. |
| [2] | 阿热孜古力·肉孜, 买买提·沙吾提, 何旭刚, 冶晓文. 基于多植被指数组合的棉花叶片叶绿素含量估算[J]. 干旱区研究, 2023, 40(11): 1865-1874. |
| [3] | 曹永香,毛东雷,薛杰,苏松领,开买尔古丽·阿不来提,蔡富艳. 绿洲-沙漠过渡带植被覆盖动态变化及其驱动因素——以新疆策勒为例[J]. 干旱区研究, 2022, 39(2): 510-521. |
| [4] | 赵生龙, 左小安, 张铜会, 吕朋, 岳平, 张晶. 乌拉特荒漠草原群落物种多样性和生物量关系对放牧强度的响应[J]. 干旱区研究, 2020, 37(1): 168-177. |
| [5] | 杨怡, 吴世新, 庄庆威, 牛雅萱. 2000—2018年古尔班通古特沙漠EVI时空变化特征[J]. 干旱区研究, 2019, 36(6): 1512-1520. |
| [6] | 潘光耀,穆桂金,岳健,贺俊霞,孙琳. 2001—2010年策勒绿洲-沙漠过渡带的变化及其成因[J]. 干旱区研究, 2014, 31(1): 169-175. |
| [7] | 李成秀, 李小雁, 杨太保, 李岳坦. 青海湖流域沙柳河草甸群落结构与数量特征[J]. 干旱区研究, 2013, 30(6): 1028-1035. |
| [8] | 孙艳玲, 郭鹏. 1982-2006年华北植被指数时空变化特征[J]. 干旱区研究, 2012, 29(2): 187-193. |
| [9] | 莫宏伟,任志远. 陕西关中地区植被指数变化多尺度分析[J]. 干旱区研究, 2012, 29(1): 59-63. |
|
||